Immigrants from Malaysia vs Alaska Native GED/Equivalency
COMPARE
Immigrants from Malaysia
Alaska Native
GED/Equivalency
GED/Equivalency Comparison
Immigrants from Malaysia
Alaska Natives
86.5%
GED/EQUIVALENCY
85.0/ 100
METRIC RATING
139th/ 347
METRIC RANK
84.7%
GED/EQUIVALENCY
8.6/ 100
METRIC RATING
218th/ 347
METRIC RANK
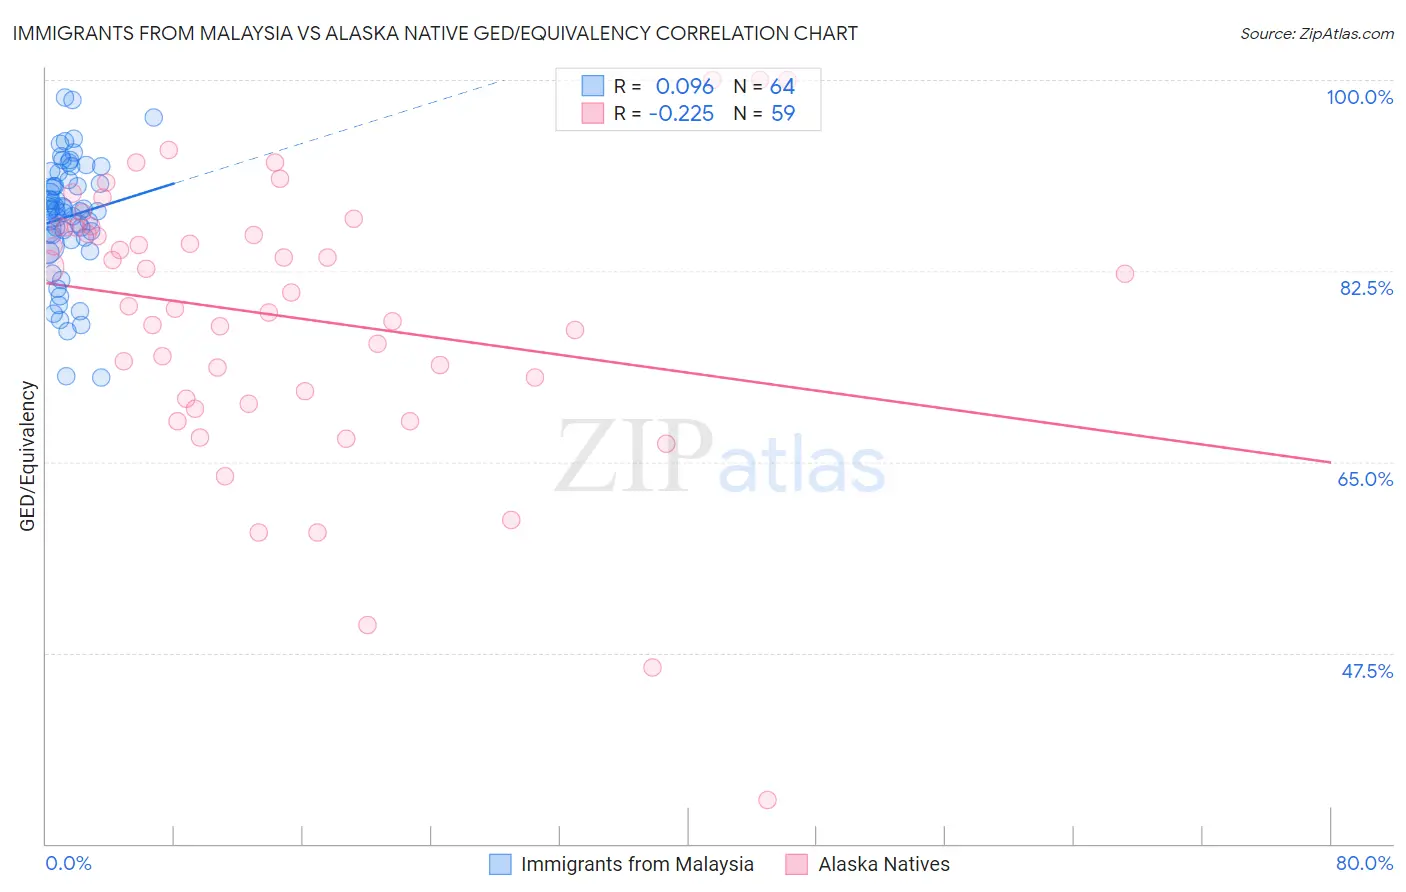
Immigrants from Malaysia vs Alaska Native GED/Equivalency Correlation Chart
The statistical analysis conducted on geographies consisting of 197,973,854 people shows a slight positive correlation between the proportion of Immigrants from Malaysia and percentage of population with at least ged/equivalency education in the United States with a correlation coefficient (R) of 0.096 and weighted average of 86.5%. Similarly, the statistical analysis conducted on geographies consisting of 76,778,887 people shows a weak negative correlation between the proportion of Alaska Natives and percentage of population with at least ged/equivalency education in the United States with a correlation coefficient (R) of -0.225 and weighted average of 84.7%, a difference of 2.1%.
GED/Equivalency Correlation Summary
| Measurement | Immigrants from Malaysia | Alaska Native |
| Minimum | 72.7% | 34.0% |
| Maximum | 98.4% | 100.0% |
| Range | 25.7% | 66.0% |
| Mean | 87.5% | 78.3% |
| Median | 88.1% | 80.5% |
| Interquartile 25% (IQ1) | 85.4% | 70.8% |
| Interquartile 75% (IQ3) | 91.2% | 86.5% |
| Interquartile Range (IQR) | 5.8% | 15.7% |
| Standard Deviation (Sample) | 5.5% | 12.9% |
| Standard Deviation (Population) | 5.5% | 12.7% |
Similar Demographics by GED/Equivalency
Demographics Similar to Immigrants from Malaysia by GED/Equivalency
In terms of ged/equivalency, the demographic groups most similar to Immigrants from Malaysia are Paraguayan (86.5%, a difference of 0.030%), Immigrants from Argentina (86.6%, a difference of 0.060%), Arab (86.6%, a difference of 0.070%), Laotian (86.5%, a difference of 0.070%), and Chilean (86.6%, a difference of 0.080%).
| Demographics | Rating | Rank | GED/Equivalency |
| Immigrants | Brazil | 88.4 /100 | #132 | Excellent 86.6% |
| Tsimshian | 88.3 /100 | #133 | Excellent 86.6% |
| Albanians | 87.7 /100 | #134 | Excellent 86.6% |
| Immigrants | Asia | 87.4 /100 | #135 | Excellent 86.6% |
| Chileans | 86.9 /100 | #136 | Excellent 86.6% |
| Arabs | 86.7 /100 | #137 | Excellent 86.6% |
| Immigrants | Argentina | 86.5 /100 | #138 | Excellent 86.6% |
| Immigrants | Malaysia | 85.0 /100 | #139 | Excellent 86.5% |
| Paraguayans | 84.1 /100 | #140 | Excellent 86.5% |
| Laotians | 83.2 /100 | #141 | Excellent 86.5% |
| Immigrants | Indonesia | 82.4 /100 | #142 | Excellent 86.4% |
| Immigrants | Pakistan | 82.4 /100 | #143 | Excellent 86.4% |
| Bolivians | 82.1 /100 | #144 | Excellent 86.4% |
| Pakistanis | 80.4 /100 | #145 | Excellent 86.4% |
| Basques | 79.5 /100 | #146 | Good 86.4% |
Demographics Similar to Alaska Natives by GED/Equivalency
In terms of ged/equivalency, the demographic groups most similar to Alaska Natives are Immigrants from Micronesia (84.7%, a difference of 0.0%), Nigerian (84.7%, a difference of 0.0%), Peruvian (84.7%, a difference of 0.030%), Potawatomi (84.7%, a difference of 0.030%), and American (84.7%, a difference of 0.030%).
| Demographics | Rating | Rank | GED/Equivalency |
| South Americans | 10.9 /100 | #211 | Poor 84.8% |
| Immigrants | Somalia | 10.6 /100 | #212 | Poor 84.8% |
| Immigrants | Philippines | 10.0 /100 | #213 | Poor 84.8% |
| Osage | 9.5 /100 | #214 | Tragic 84.8% |
| Peruvians | 9.2 /100 | #215 | Tragic 84.7% |
| Immigrants | Micronesia | 8.7 /100 | #216 | Tragic 84.7% |
| Nigerians | 8.6 /100 | #217 | Tragic 84.7% |
| Alaska Natives | 8.6 /100 | #218 | Tragic 84.7% |
| Potawatomi | 8.2 /100 | #219 | Tragic 84.7% |
| Americans | 8.2 /100 | #220 | Tragic 84.7% |
| Taiwanese | 8.1 /100 | #221 | Tragic 84.7% |
| Iroquois | 7.5 /100 | #222 | Tragic 84.6% |
| Immigrants | Uzbekistan | 7.1 /100 | #223 | Tragic 84.6% |
| French American Indians | 6.3 /100 | #224 | Tragic 84.6% |
| Immigrants | Thailand | 5.8 /100 | #225 | Tragic 84.5% |