Finnish vs Alaska Native GED/Equivalency
COMPARE
Finnish
Alaska Native
GED/Equivalency
GED/Equivalency Comparison
Finns
Alaska Natives
88.2%
GED/EQUIVALENCY
99.6/ 100
METRIC RATING
41st/ 347
METRIC RANK
84.7%
GED/EQUIVALENCY
8.6/ 100
METRIC RATING
218th/ 347
METRIC RANK
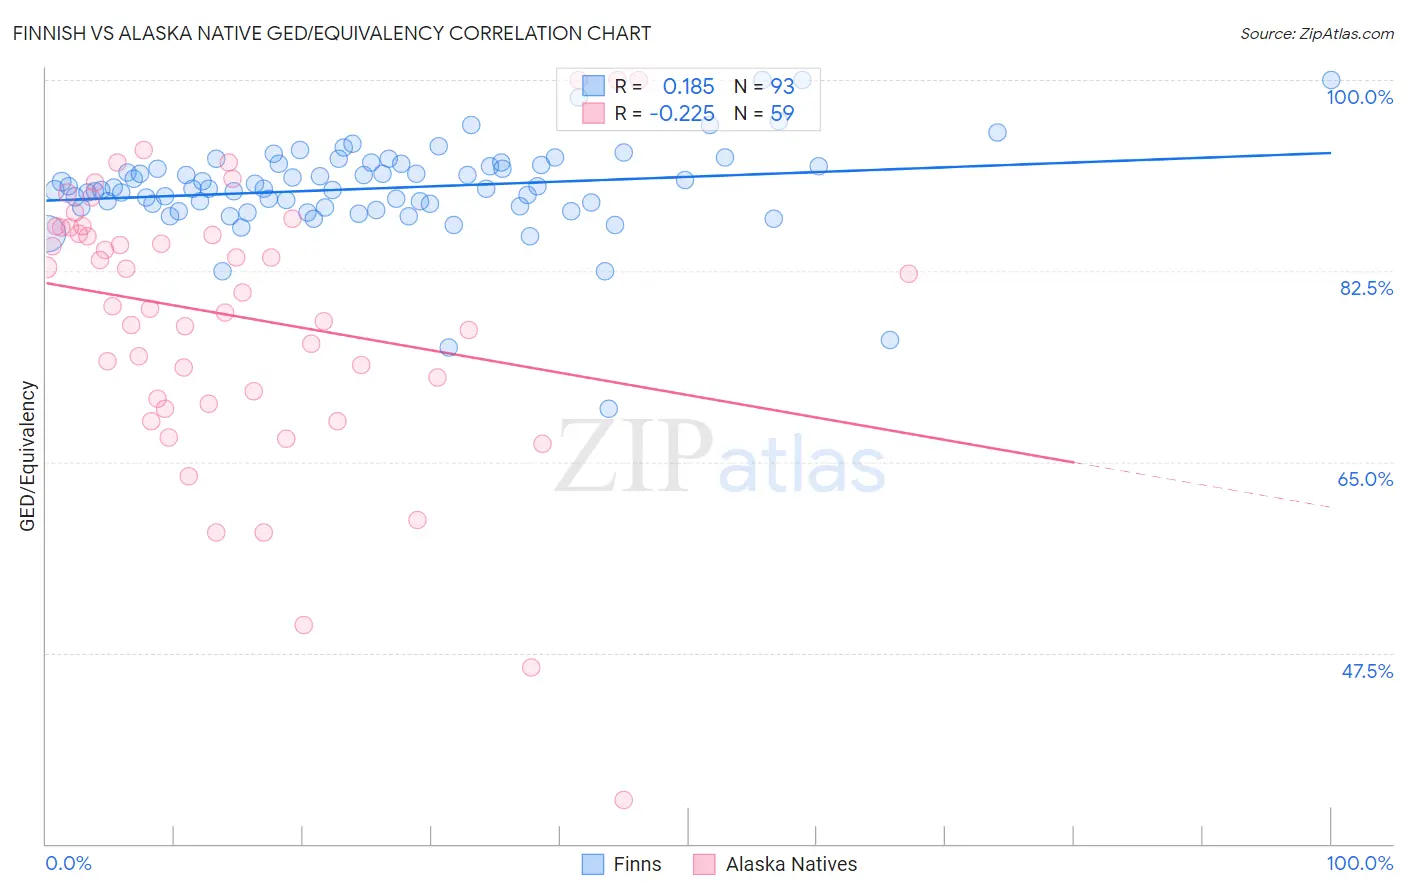
Finnish vs Alaska Native GED/Equivalency Correlation Chart
The statistical analysis conducted on geographies consisting of 404,676,025 people shows a poor positive correlation between the proportion of Finns and percentage of population with at least ged/equivalency education in the United States with a correlation coefficient (R) of 0.185 and weighted average of 88.2%. Similarly, the statistical analysis conducted on geographies consisting of 76,778,887 people shows a weak negative correlation between the proportion of Alaska Natives and percentage of population with at least ged/equivalency education in the United States with a correlation coefficient (R) of -0.225 and weighted average of 84.7%, a difference of 4.1%.
GED/Equivalency Correlation Summary
| Measurement | Finnish | Alaska Native |
| Minimum | 69.9% | 34.0% |
| Maximum | 100.0% | 100.0% |
| Range | 30.1% | 66.0% |
| Mean | 90.1% | 78.3% |
| Median | 90.1% | 80.5% |
| Interquartile 25% (IQ1) | 88.4% | 70.8% |
| Interquartile 75% (IQ3) | 92.3% | 86.5% |
| Interquartile Range (IQR) | 3.9% | 15.7% |
| Standard Deviation (Sample) | 4.4% | 12.9% |
| Standard Deviation (Population) | 4.3% | 12.7% |
Similar Demographics by GED/Equivalency
Demographics Similar to Finns by GED/Equivalency
In terms of ged/equivalency, the demographic groups most similar to Finns are Italian (88.2%, a difference of 0.010%), Immigrants from Israel (88.2%, a difference of 0.030%), Cambodian (88.2%, a difference of 0.030%), Immigrants from Scotland (88.2%, a difference of 0.030%), and Macedonian (88.1%, a difference of 0.060%).
| Demographics | Rating | Rank | GED/Equivalency |
| Immigrants | Japan | 99.7 /100 | #34 | Exceptional 88.4% |
| Immigrants | South Central Asia | 99.7 /100 | #35 | Exceptional 88.4% |
| Immigrants | Belgium | 99.7 /100 | #36 | Exceptional 88.3% |
| Immigrants | Austria | 99.7 /100 | #37 | Exceptional 88.3% |
| Burmese | 99.7 /100 | #38 | Exceptional 88.3% |
| Immigrants | Israel | 99.6 /100 | #39 | Exceptional 88.2% |
| Italians | 99.6 /100 | #40 | Exceptional 88.2% |
| Finns | 99.6 /100 | #41 | Exceptional 88.2% |
| Cambodians | 99.6 /100 | #42 | Exceptional 88.2% |
| Immigrants | Scotland | 99.6 /100 | #43 | Exceptional 88.2% |
| Macedonians | 99.5 /100 | #44 | Exceptional 88.1% |
| Czechs | 99.5 /100 | #45 | Exceptional 88.1% |
| Immigrants | Switzerland | 99.5 /100 | #46 | Exceptional 88.1% |
| Immigrants | Latvia | 99.5 /100 | #47 | Exceptional 88.1% |
| Greeks | 99.5 /100 | #48 | Exceptional 88.1% |
Demographics Similar to Alaska Natives by GED/Equivalency
In terms of ged/equivalency, the demographic groups most similar to Alaska Natives are Immigrants from Micronesia (84.7%, a difference of 0.0%), Nigerian (84.7%, a difference of 0.0%), Peruvian (84.7%, a difference of 0.030%), Potawatomi (84.7%, a difference of 0.030%), and American (84.7%, a difference of 0.030%).
| Demographics | Rating | Rank | GED/Equivalency |
| South Americans | 10.9 /100 | #211 | Poor 84.8% |
| Immigrants | Somalia | 10.6 /100 | #212 | Poor 84.8% |
| Immigrants | Philippines | 10.0 /100 | #213 | Poor 84.8% |
| Osage | 9.5 /100 | #214 | Tragic 84.8% |
| Peruvians | 9.2 /100 | #215 | Tragic 84.7% |
| Immigrants | Micronesia | 8.7 /100 | #216 | Tragic 84.7% |
| Nigerians | 8.6 /100 | #217 | Tragic 84.7% |
| Alaska Natives | 8.6 /100 | #218 | Tragic 84.7% |
| Potawatomi | 8.2 /100 | #219 | Tragic 84.7% |
| Americans | 8.2 /100 | #220 | Tragic 84.7% |
| Taiwanese | 8.1 /100 | #221 | Tragic 84.7% |
| Iroquois | 7.5 /100 | #222 | Tragic 84.6% |
| Immigrants | Uzbekistan | 7.1 /100 | #223 | Tragic 84.6% |
| French American Indians | 6.3 /100 | #224 | Tragic 84.6% |
| Immigrants | Thailand | 5.8 /100 | #225 | Tragic 84.5% |