Immigrants from Malaysia vs Fijian GED/Equivalency
COMPARE
Immigrants from Malaysia
Fijian
GED/Equivalency
GED/Equivalency Comparison
Immigrants from Malaysia
Fijians
86.5%
GED/EQUIVALENCY
85.0/ 100
METRIC RATING
139th/ 347
METRIC RANK
81.6%
GED/EQUIVALENCY
0.0/ 100
METRIC RATING
300th/ 347
METRIC RANK
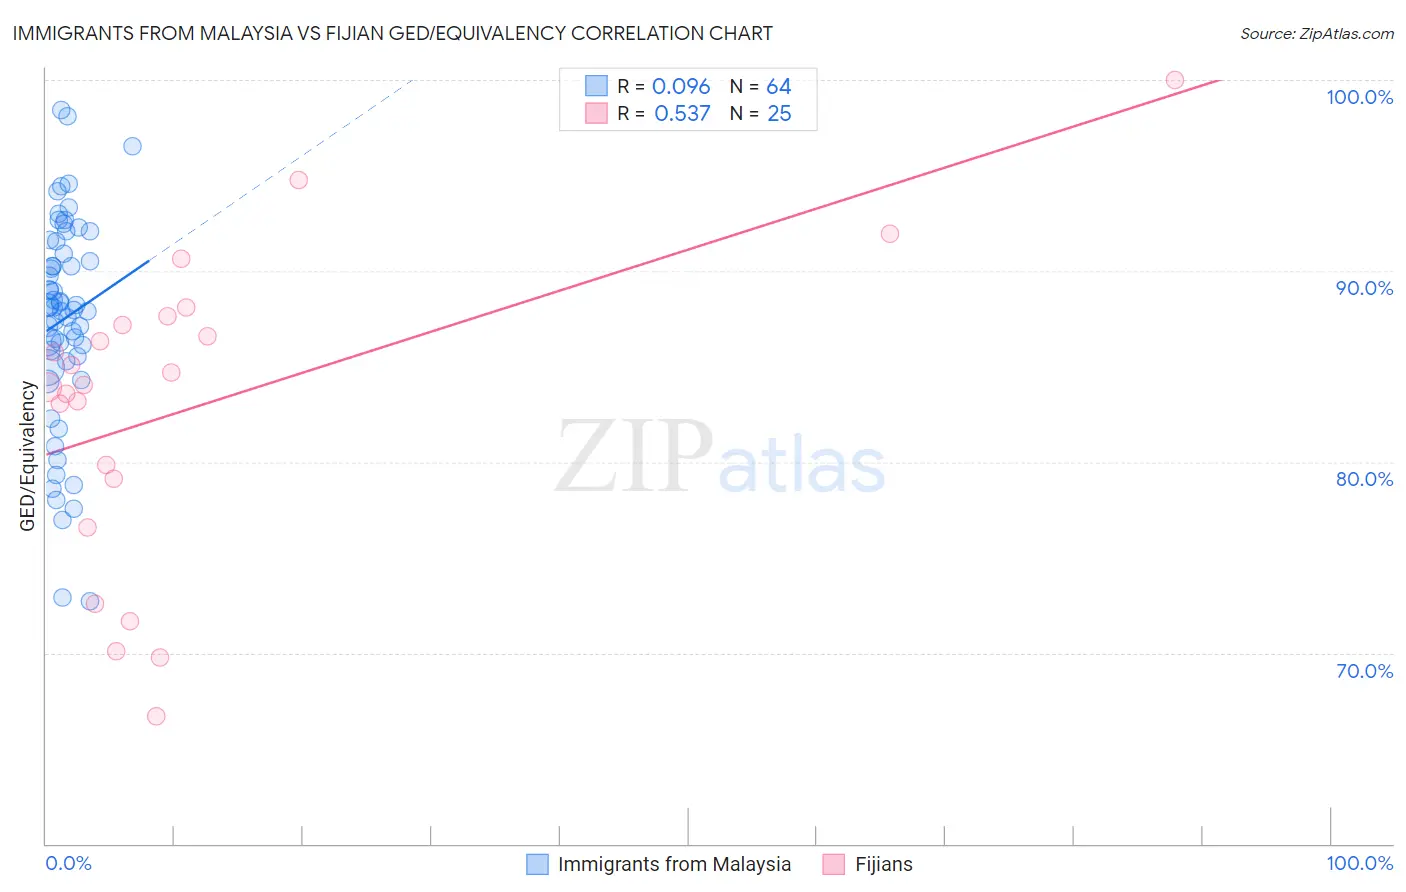
Immigrants from Malaysia vs Fijian GED/Equivalency Correlation Chart
The statistical analysis conducted on geographies consisting of 197,973,854 people shows a slight positive correlation between the proportion of Immigrants from Malaysia and percentage of population with at least ged/equivalency education in the United States with a correlation coefficient (R) of 0.096 and weighted average of 86.5%. Similarly, the statistical analysis conducted on geographies consisting of 55,948,842 people shows a substantial positive correlation between the proportion of Fijians and percentage of population with at least ged/equivalency education in the United States with a correlation coefficient (R) of 0.537 and weighted average of 81.6%, a difference of 6.0%.
GED/Equivalency Correlation Summary
| Measurement | Immigrants from Malaysia | Fijian |
| Minimum | 72.7% | 66.7% |
| Maximum | 98.4% | 100.0% |
| Range | 25.7% | 33.3% |
| Mean | 87.5% | 82.9% |
| Median | 88.1% | 84.0% |
| Interquartile 25% (IQ1) | 85.4% | 77.9% |
| Interquartile 75% (IQ3) | 91.2% | 87.4% |
| Interquartile Range (IQR) | 5.8% | 9.6% |
| Standard Deviation (Sample) | 5.5% | 8.1% |
| Standard Deviation (Population) | 5.5% | 8.0% |
Similar Demographics by GED/Equivalency
Demographics Similar to Immigrants from Malaysia by GED/Equivalency
In terms of ged/equivalency, the demographic groups most similar to Immigrants from Malaysia are Paraguayan (86.5%, a difference of 0.030%), Immigrants from Argentina (86.6%, a difference of 0.060%), Arab (86.6%, a difference of 0.070%), Laotian (86.5%, a difference of 0.070%), and Chilean (86.6%, a difference of 0.080%).
| Demographics | Rating | Rank | GED/Equivalency |
| Immigrants | Brazil | 88.4 /100 | #132 | Excellent 86.6% |
| Tsimshian | 88.3 /100 | #133 | Excellent 86.6% |
| Albanians | 87.7 /100 | #134 | Excellent 86.6% |
| Immigrants | Asia | 87.4 /100 | #135 | Excellent 86.6% |
| Chileans | 86.9 /100 | #136 | Excellent 86.6% |
| Arabs | 86.7 /100 | #137 | Excellent 86.6% |
| Immigrants | Argentina | 86.5 /100 | #138 | Excellent 86.6% |
| Immigrants | Malaysia | 85.0 /100 | #139 | Excellent 86.5% |
| Paraguayans | 84.1 /100 | #140 | Excellent 86.5% |
| Laotians | 83.2 /100 | #141 | Excellent 86.5% |
| Immigrants | Indonesia | 82.4 /100 | #142 | Excellent 86.4% |
| Immigrants | Pakistan | 82.4 /100 | #143 | Excellent 86.4% |
| Bolivians | 82.1 /100 | #144 | Excellent 86.4% |
| Pakistanis | 80.4 /100 | #145 | Excellent 86.4% |
| Basques | 79.5 /100 | #146 | Good 86.4% |
Demographics Similar to Fijians by GED/Equivalency
In terms of ged/equivalency, the demographic groups most similar to Fijians are Dutch West Indian (81.6%, a difference of 0.060%), Ecuadorian (81.7%, a difference of 0.070%), Immigrants from Haiti (81.6%, a difference of 0.10%), Immigrants from Portugal (81.6%, a difference of 0.10%), and Ute (81.8%, a difference of 0.20%).
| Demographics | Rating | Rank | GED/Equivalency |
| British West Indians | 0.0 /100 | #293 | Tragic 82.0% |
| Immigrants | St. Vincent and the Grenadines | 0.0 /100 | #294 | Tragic 82.0% |
| Nepalese | 0.0 /100 | #295 | Tragic 81.9% |
| Vietnamese | 0.0 /100 | #296 | Tragic 81.9% |
| Immigrants | Bangladesh | 0.0 /100 | #297 | Tragic 81.9% |
| Ute | 0.0 /100 | #298 | Tragic 81.8% |
| Ecuadorians | 0.0 /100 | #299 | Tragic 81.7% |
| Fijians | 0.0 /100 | #300 | Tragic 81.6% |
| Dutch West Indians | 0.0 /100 | #301 | Tragic 81.6% |
| Immigrants | Haiti | 0.0 /100 | #302 | Tragic 81.6% |
| Immigrants | Portugal | 0.0 /100 | #303 | Tragic 81.6% |
| Navajo | 0.0 /100 | #304 | Tragic 81.5% |
| Immigrants | Grenada | 0.0 /100 | #305 | Tragic 81.3% |
| Guyanese | 0.0 /100 | #306 | Tragic 81.3% |
| Immigrants | Dominica | 0.0 /100 | #307 | Tragic 81.1% |