Immigrants from Malaysia vs Alaska Native Receiving Food Stamps
COMPARE
Immigrants from Malaysia
Alaska Native
Receiving Food Stamps
Receiving Food Stamps Comparison
Immigrants from Malaysia
Alaska Natives
10.4%
RECEIVING FOOD STAMPS
96.5/ 100
METRIC RATING
105th/ 347
METRIC RANK
15.6%
RECEIVING FOOD STAMPS
0.0/ 100
METRIC RATING
292nd/ 347
METRIC RANK
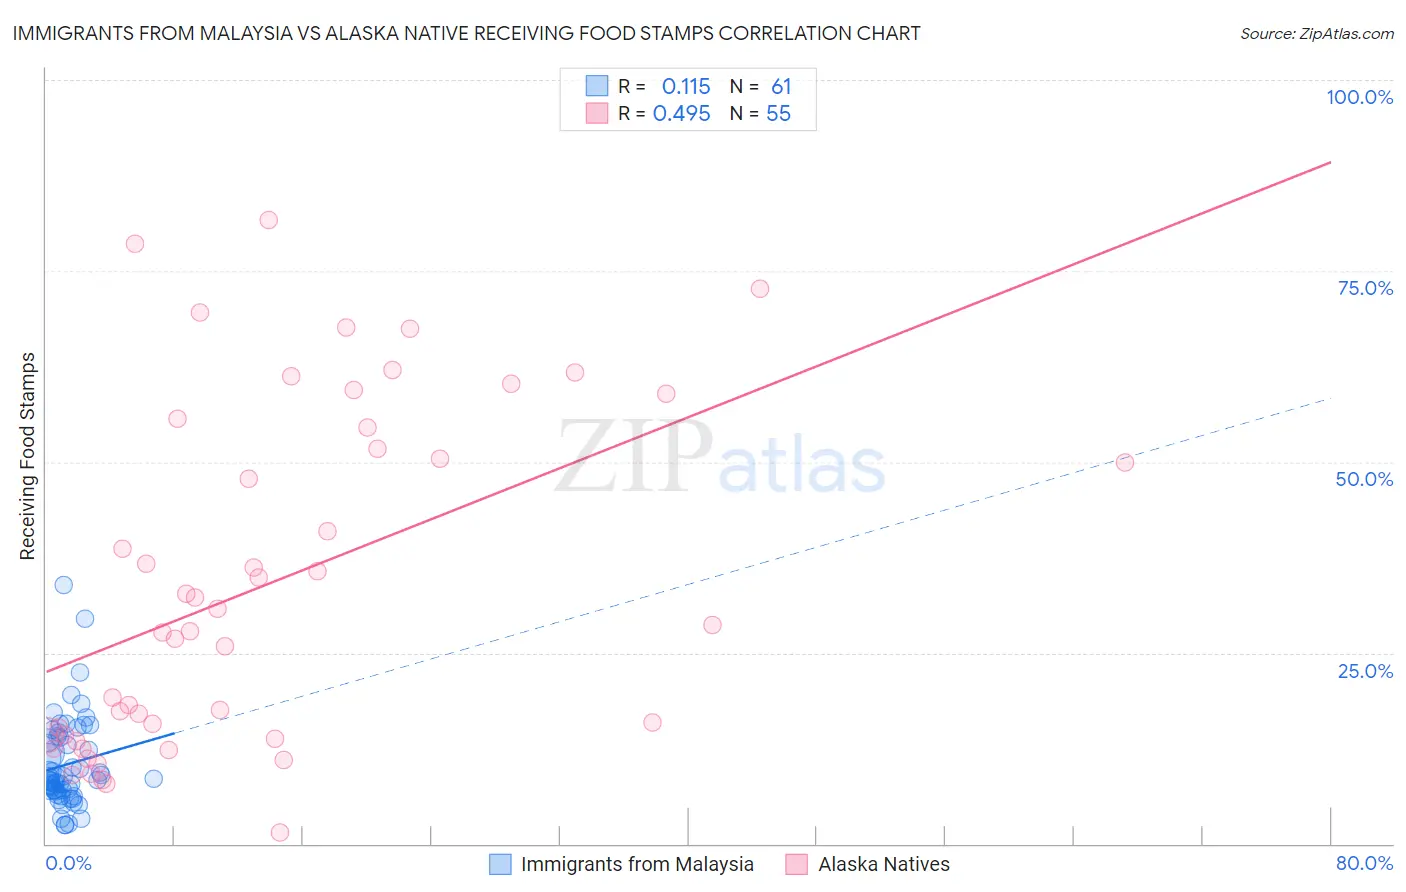
Immigrants from Malaysia vs Alaska Native Receiving Food Stamps Correlation Chart
The statistical analysis conducted on geographies consisting of 197,649,063 people shows a poor positive correlation between the proportion of Immigrants from Malaysia and percentage of population receiving government assistance and/or food stamps in the United States with a correlation coefficient (R) of 0.115 and weighted average of 10.4%. Similarly, the statistical analysis conducted on geographies consisting of 76,703,689 people shows a moderate positive correlation between the proportion of Alaska Natives and percentage of population receiving government assistance and/or food stamps in the United States with a correlation coefficient (R) of 0.495 and weighted average of 15.6%, a difference of 50.4%.
Receiving Food Stamps Correlation Summary
| Measurement | Immigrants from Malaysia | Alaska Native |
| Minimum | 2.4% | 1.5% |
| Maximum | 33.8% | 81.7% |
| Range | 31.4% | 80.2% |
| Mean | 10.4% | 33.9% |
| Median | 8.5% | 28.6% |
| Interquartile 25% (IQ1) | 6.9% | 14.3% |
| Interquartile 75% (IQ3) | 14.0% | 54.5% |
| Interquartile Range (IQR) | 7.1% | 40.2% |
| Standard Deviation (Sample) | 6.0% | 22.1% |
| Standard Deviation (Population) | 5.9% | 21.9% |
Similar Demographics by Receiving Food Stamps
Demographics Similar to Immigrants from Malaysia by Receiving Food Stamps
In terms of receiving food stamps, the demographic groups most similar to Immigrants from Malaysia are Immigrants from Italy (10.4%, a difference of 0.090%), Korean (10.4%, a difference of 0.24%), Carpatho Rusyn (10.4%, a difference of 0.27%), Immigrants from Hungary (10.3%, a difference of 0.32%), and Immigrants from Pakistan (10.4%, a difference of 0.32%).
| Demographics | Rating | Rank | Receiving Food Stamps |
| Immigrants | Egypt | 97.1 /100 | #98 | Exceptional 10.3% |
| Serbians | 97.0 /100 | #99 | Exceptional 10.3% |
| Immigrants | Western Europe | 96.9 /100 | #100 | Exceptional 10.3% |
| Palestinians | 96.9 /100 | #101 | Exceptional 10.3% |
| Immigrants | Europe | 96.8 /100 | #102 | Exceptional 10.3% |
| Immigrants | Latvia | 96.8 /100 | #103 | Exceptional 10.3% |
| Immigrants | Hungary | 96.7 /100 | #104 | Exceptional 10.3% |
| Immigrants | Malaysia | 96.5 /100 | #105 | Exceptional 10.4% |
| Immigrants | Italy | 96.4 /100 | #106 | Exceptional 10.4% |
| Koreans | 96.3 /100 | #107 | Exceptional 10.4% |
| Carpatho Rusyns | 96.2 /100 | #108 | Exceptional 10.4% |
| Immigrants | Pakistan | 96.2 /100 | #109 | Exceptional 10.4% |
| Pakistanis | 95.9 /100 | #110 | Exceptional 10.4% |
| Romanians | 95.8 /100 | #111 | Exceptional 10.4% |
| Mongolians | 95.8 /100 | #112 | Exceptional 10.5% |
Demographics Similar to Alaska Natives by Receiving Food Stamps
In terms of receiving food stamps, the demographic groups most similar to Alaska Natives are Vietnamese (15.7%, a difference of 0.30%), Immigrants from Latin America (15.7%, a difference of 0.41%), Honduran (15.5%, a difference of 0.44%), Immigrants from Honduras (15.7%, a difference of 0.74%), and Tsimshian (15.7%, a difference of 0.75%).
| Demographics | Rating | Rank | Receiving Food Stamps |
| Immigrants | Liberia | 0.0 /100 | #285 | Tragic 15.1% |
| Africans | 0.0 /100 | #286 | Tragic 15.1% |
| Immigrants | Mexico | 0.0 /100 | #287 | Tragic 15.2% |
| Immigrants | Belize | 0.0 /100 | #288 | Tragic 15.2% |
| Immigrants | Senegal | 0.0 /100 | #289 | Tragic 15.3% |
| Senegalese | 0.0 /100 | #290 | Tragic 15.4% |
| Hondurans | 0.0 /100 | #291 | Tragic 15.5% |
| Alaska Natives | 0.0 /100 | #292 | Tragic 15.6% |
| Vietnamese | 0.0 /100 | #293 | Tragic 15.7% |
| Immigrants | Latin America | 0.0 /100 | #294 | Tragic 15.7% |
| Immigrants | Honduras | 0.0 /100 | #295 | Tragic 15.7% |
| Tsimshian | 0.0 /100 | #296 | Tragic 15.7% |
| Immigrants | Bahamas | 0.0 /100 | #297 | Tragic 15.8% |
| Immigrants | Trinidad and Tobago | 0.0 /100 | #298 | Tragic 15.8% |
| Hispanics or Latinos | 0.0 /100 | #299 | Tragic 15.8% |