Immigrants from Cambodia vs Alaska Native GED/Equivalency
COMPARE
Immigrants from Cambodia
Alaska Native
GED/Equivalency
GED/Equivalency Comparison
Immigrants from Cambodia
Alaska Natives
82.2%
GED/EQUIVALENCY
0.0/ 100
METRIC RATING
289th/ 347
METRIC RANK
84.7%
GED/EQUIVALENCY
8.6/ 100
METRIC RATING
218th/ 347
METRIC RANK
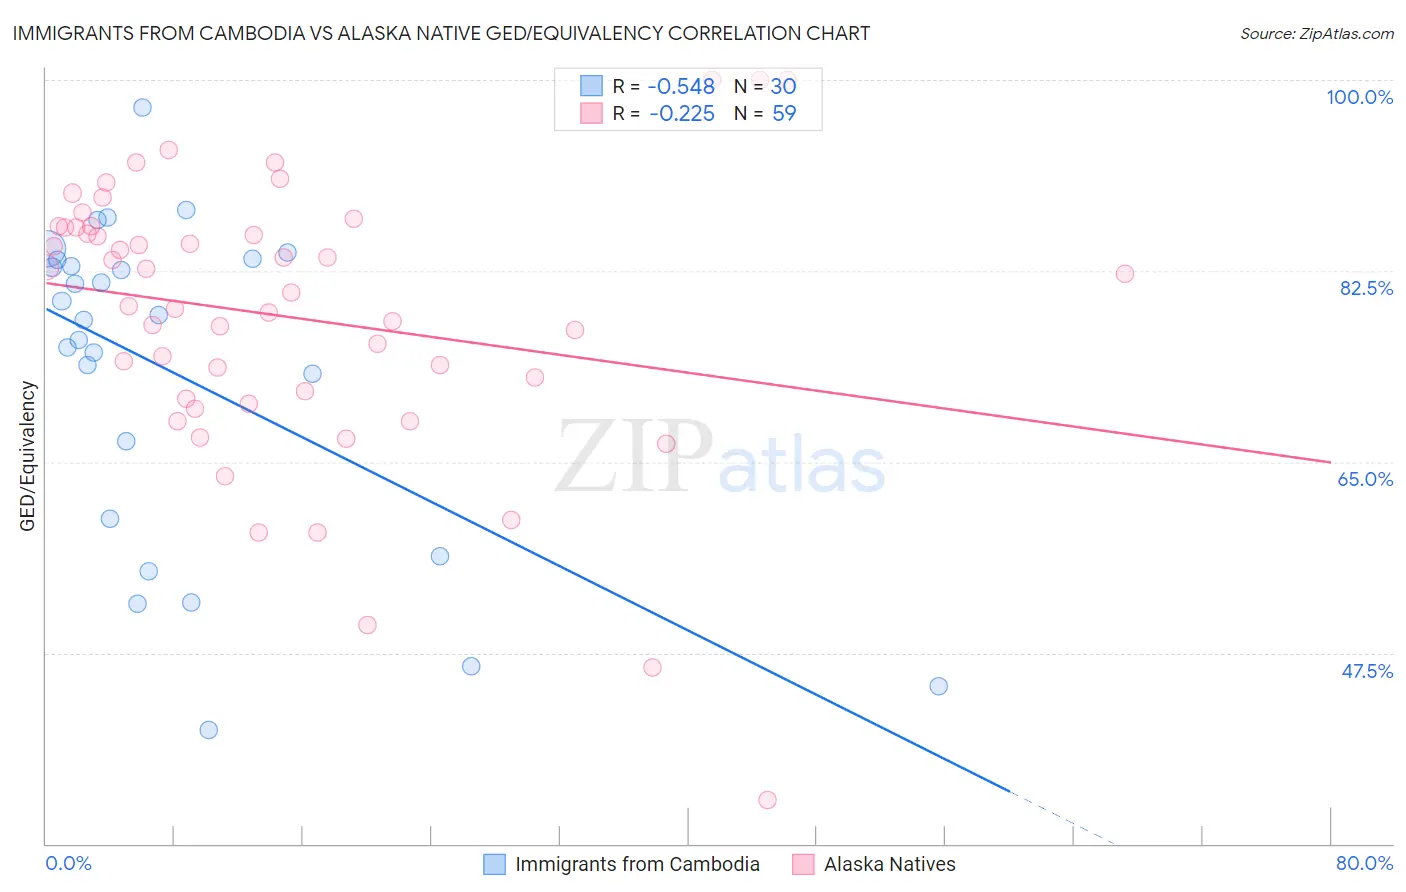
Immigrants from Cambodia vs Alaska Native GED/Equivalency Correlation Chart
The statistical analysis conducted on geographies consisting of 205,153,442 people shows a substantial negative correlation between the proportion of Immigrants from Cambodia and percentage of population with at least ged/equivalency education in the United States with a correlation coefficient (R) of -0.548 and weighted average of 82.2%. Similarly, the statistical analysis conducted on geographies consisting of 76,778,887 people shows a weak negative correlation between the proportion of Alaska Natives and percentage of population with at least ged/equivalency education in the United States with a correlation coefficient (R) of -0.225 and weighted average of 84.7%, a difference of 3.0%.
GED/Equivalency Correlation Summary
| Measurement | Immigrants from Cambodia | Alaska Native |
| Minimum | 40.4% | 34.0% |
| Maximum | 97.5% | 100.0% |
| Range | 57.1% | 66.0% |
| Mean | 73.0% | 78.3% |
| Median | 78.2% | 80.5% |
| Interquartile 25% (IQ1) | 59.8% | 70.8% |
| Interquartile 75% (IQ3) | 83.5% | 86.5% |
| Interquartile Range (IQR) | 23.7% | 15.7% |
| Standard Deviation (Sample) | 15.0% | 12.9% |
| Standard Deviation (Population) | 14.8% | 12.7% |
Similar Demographics by GED/Equivalency
Demographics Similar to Immigrants from Cambodia by GED/Equivalency
In terms of ged/equivalency, the demographic groups most similar to Immigrants from Cambodia are Pueblo (82.3%, a difference of 0.080%), Japanese (82.4%, a difference of 0.18%), Immigrants from West Indies (82.4%, a difference of 0.19%), Haitian (82.1%, a difference of 0.19%), and Cajun (82.4%, a difference of 0.22%).
| Demographics | Rating | Rank | GED/Equivalency |
| Immigrants | Immigrants | 0.1 /100 | #282 | Tragic 82.6% |
| Indonesians | 0.1 /100 | #283 | Tragic 82.5% |
| Immigrants | Barbados | 0.1 /100 | #284 | Tragic 82.4% |
| Cajuns | 0.0 /100 | #285 | Tragic 82.4% |
| Immigrants | West Indies | 0.0 /100 | #286 | Tragic 82.4% |
| Japanese | 0.0 /100 | #287 | Tragic 82.4% |
| Pueblo | 0.0 /100 | #288 | Tragic 82.3% |
| Immigrants | Cambodia | 0.0 /100 | #289 | Tragic 82.2% |
| Haitians | 0.0 /100 | #290 | Tragic 82.1% |
| Cubans | 0.0 /100 | #291 | Tragic 82.0% |
| Paiute | 0.0 /100 | #292 | Tragic 82.0% |
| British West Indians | 0.0 /100 | #293 | Tragic 82.0% |
| Immigrants | St. Vincent and the Grenadines | 0.0 /100 | #294 | Tragic 82.0% |
| Nepalese | 0.0 /100 | #295 | Tragic 81.9% |
| Vietnamese | 0.0 /100 | #296 | Tragic 81.9% |
Demographics Similar to Alaska Natives by GED/Equivalency
In terms of ged/equivalency, the demographic groups most similar to Alaska Natives are Immigrants from Micronesia (84.7%, a difference of 0.0%), Nigerian (84.7%, a difference of 0.0%), Peruvian (84.7%, a difference of 0.030%), Potawatomi (84.7%, a difference of 0.030%), and American (84.7%, a difference of 0.030%).
| Demographics | Rating | Rank | GED/Equivalency |
| South Americans | 10.9 /100 | #211 | Poor 84.8% |
| Immigrants | Somalia | 10.6 /100 | #212 | Poor 84.8% |
| Immigrants | Philippines | 10.0 /100 | #213 | Poor 84.8% |
| Osage | 9.5 /100 | #214 | Tragic 84.8% |
| Peruvians | 9.2 /100 | #215 | Tragic 84.7% |
| Immigrants | Micronesia | 8.7 /100 | #216 | Tragic 84.7% |
| Nigerians | 8.6 /100 | #217 | Tragic 84.7% |
| Alaska Natives | 8.6 /100 | #218 | Tragic 84.7% |
| Potawatomi | 8.2 /100 | #219 | Tragic 84.7% |
| Americans | 8.2 /100 | #220 | Tragic 84.7% |
| Taiwanese | 8.1 /100 | #221 | Tragic 84.7% |
| Iroquois | 7.5 /100 | #222 | Tragic 84.6% |
| Immigrants | Uzbekistan | 7.1 /100 | #223 | Tragic 84.6% |
| French American Indians | 6.3 /100 | #224 | Tragic 84.6% |
| Immigrants | Thailand | 5.8 /100 | #225 | Tragic 84.5% |