Immigrants from Malaysia vs Alaska Native Cognitive Disability
COMPARE
Immigrants from Malaysia
Alaska Native
Cognitive Disability
Cognitive Disability Comparison
Immigrants from Malaysia
Alaska Natives
17.1%
COGNITIVE DISABILITY
79.3/ 100
METRIC RATING
154th/ 347
METRIC RANK
17.5%
COGNITIVE DISABILITY
10.4/ 100
METRIC RATING
206th/ 347
METRIC RANK
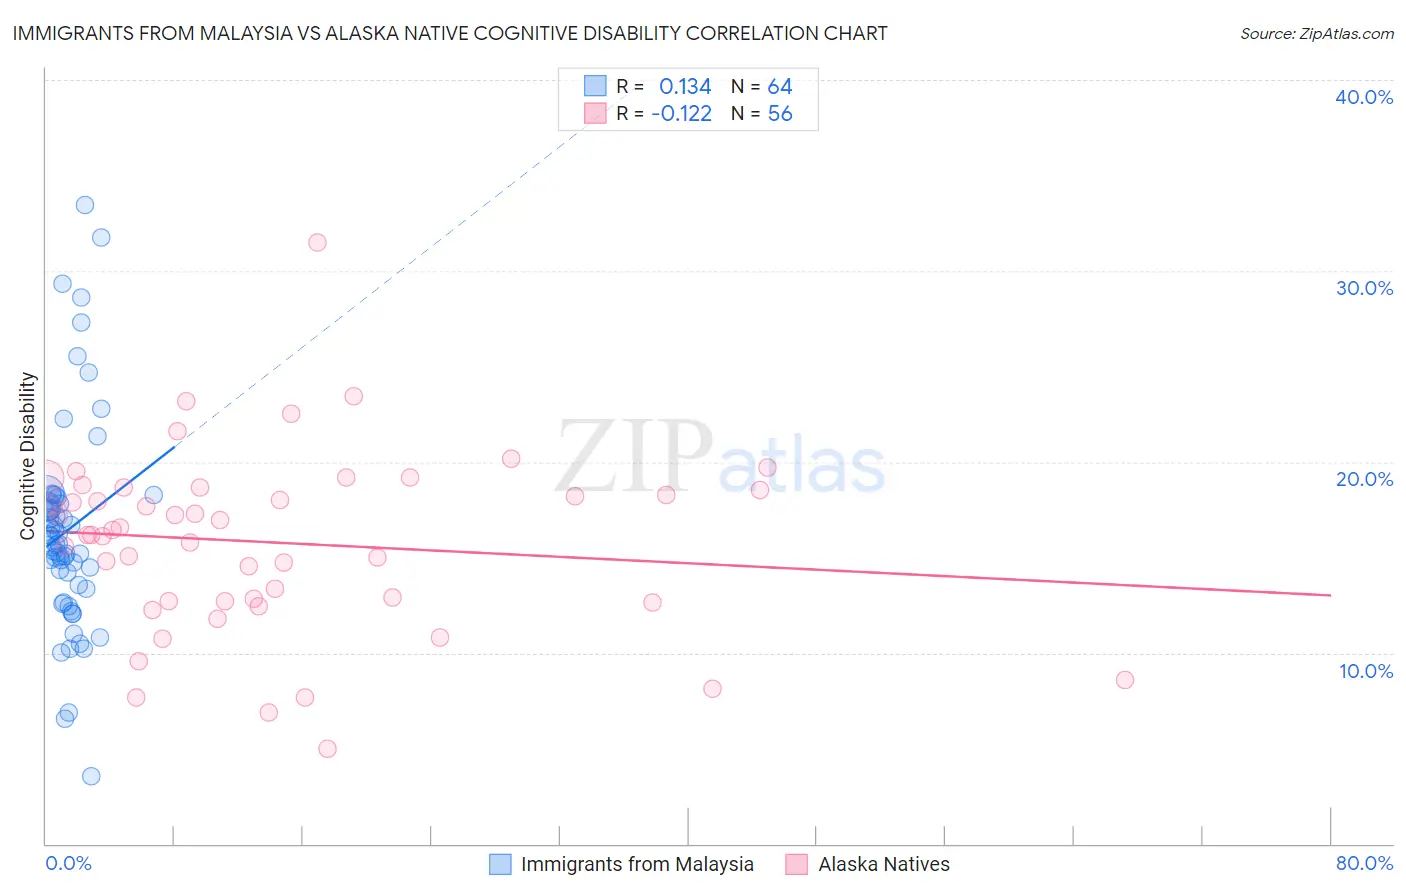
Immigrants from Malaysia vs Alaska Native Cognitive Disability Correlation Chart
The statistical analysis conducted on geographies consisting of 197,973,854 people shows a poor positive correlation between the proportion of Immigrants from Malaysia and percentage of population with cognitive disability in the United States with a correlation coefficient (R) of 0.134 and weighted average of 17.1%. Similarly, the statistical analysis conducted on geographies consisting of 76,778,470 people shows a poor negative correlation between the proportion of Alaska Natives and percentage of population with cognitive disability in the United States with a correlation coefficient (R) of -0.122 and weighted average of 17.5%, a difference of 2.5%.
Cognitive Disability Correlation Summary
| Measurement | Immigrants from Malaysia | Alaska Native |
| Minimum | 3.5% | 5.0% |
| Maximum | 33.4% | 31.5% |
| Range | 29.9% | 26.5% |
| Mean | 16.4% | 15.8% |
| Median | 15.7% | 16.3% |
| Interquartile 25% (IQ1) | 13.4% | 12.7% |
| Interquartile 75% (IQ3) | 18.0% | 18.6% |
| Interquartile Range (IQR) | 4.6% | 5.9% |
| Standard Deviation (Sample) | 5.6% | 4.7% |
| Standard Deviation (Population) | 5.5% | 4.7% |
Similar Demographics by Cognitive Disability
Demographics Similar to Immigrants from Malaysia by Cognitive Disability
In terms of cognitive disability, the demographic groups most similar to Immigrants from Malaysia are Brazilian (17.1%, a difference of 0.020%), Sri Lankan (17.1%, a difference of 0.020%), Immigrants from Kazakhstan (17.1%, a difference of 0.050%), Immigrants from Australia (17.1%, a difference of 0.14%), and Immigrants from Indonesia (17.1%, a difference of 0.16%).
| Demographics | Rating | Rank | Cognitive Disability |
| Scotch-Irish | 85.9 /100 | #147 | Excellent 17.1% |
| French Canadians | 85.7 /100 | #148 | Excellent 17.1% |
| Cypriots | 85.7 /100 | #149 | Excellent 17.1% |
| Basques | 85.5 /100 | #150 | Excellent 17.1% |
| Syrians | 83.0 /100 | #151 | Excellent 17.1% |
| Immigrants | Indonesia | 82.7 /100 | #152 | Excellent 17.1% |
| Immigrants | Kazakhstan | 80.5 /100 | #153 | Excellent 17.1% |
| Immigrants | Malaysia | 79.3 /100 | #154 | Good 17.1% |
| Brazilians | 78.9 /100 | #155 | Good 17.1% |
| Sri Lankans | 78.9 /100 | #156 | Good 17.1% |
| Immigrants | Australia | 76.0 /100 | #157 | Good 17.1% |
| Celtics | 74.1 /100 | #158 | Good 17.1% |
| Immigrants | Latvia | 73.2 /100 | #159 | Good 17.2% |
| Australians | 72.4 /100 | #160 | Good 17.2% |
| Americans | 72.2 /100 | #161 | Good 17.2% |
Demographics Similar to Alaska Natives by Cognitive Disability
In terms of cognitive disability, the demographic groups most similar to Alaska Natives are Immigrants from Zimbabwe (17.5%, a difference of 0.040%), Puget Sound Salish (17.5%, a difference of 0.040%), Immigrants from Caribbean (17.5%, a difference of 0.050%), Immigrants from Latin America (17.6%, a difference of 0.050%), and Immigrants from Cameroon (17.6%, a difference of 0.090%).
| Demographics | Rating | Rank | Cognitive Disability |
| Immigrants | Singapore | 14.3 /100 | #199 | Poor 17.5% |
| Haitians | 14.1 /100 | #200 | Poor 17.5% |
| South American Indians | 13.0 /100 | #201 | Poor 17.5% |
| Immigrants | Morocco | 12.0 /100 | #202 | Poor 17.5% |
| Immigrants | Caribbean | 11.0 /100 | #203 | Poor 17.5% |
| Immigrants | Zimbabwe | 11.0 /100 | #204 | Poor 17.5% |
| Puget Sound Salish | 10.9 /100 | #205 | Poor 17.5% |
| Alaska Natives | 10.4 /100 | #206 | Poor 17.5% |
| Immigrants | Latin America | 9.7 /100 | #207 | Tragic 17.6% |
| Immigrants | Cameroon | 9.3 /100 | #208 | Tragic 17.6% |
| Immigrants | Trinidad and Tobago | 8.7 /100 | #209 | Tragic 17.6% |
| Immigrants | Jamaica | 8.5 /100 | #210 | Tragic 17.6% |
| Taiwanese | 7.7 /100 | #211 | Tragic 17.6% |
| Immigrants | Oceania | 7.3 /100 | #212 | Tragic 17.6% |
| Hawaiians | 7.2 /100 | #213 | Tragic 17.6% |