Immigrants from Malaysia vs Pennsylvania German GED/Equivalency
COMPARE
Immigrants from Malaysia
Pennsylvania German
GED/Equivalency
GED/Equivalency Comparison
Immigrants from Malaysia
Pennsylvania Germans
86.5%
GED/EQUIVALENCY
85.0/ 100
METRIC RATING
139th/ 347
METRIC RANK
82.9%
GED/EQUIVALENCY
0.1/ 100
METRIC RATING
273rd/ 347
METRIC RANK
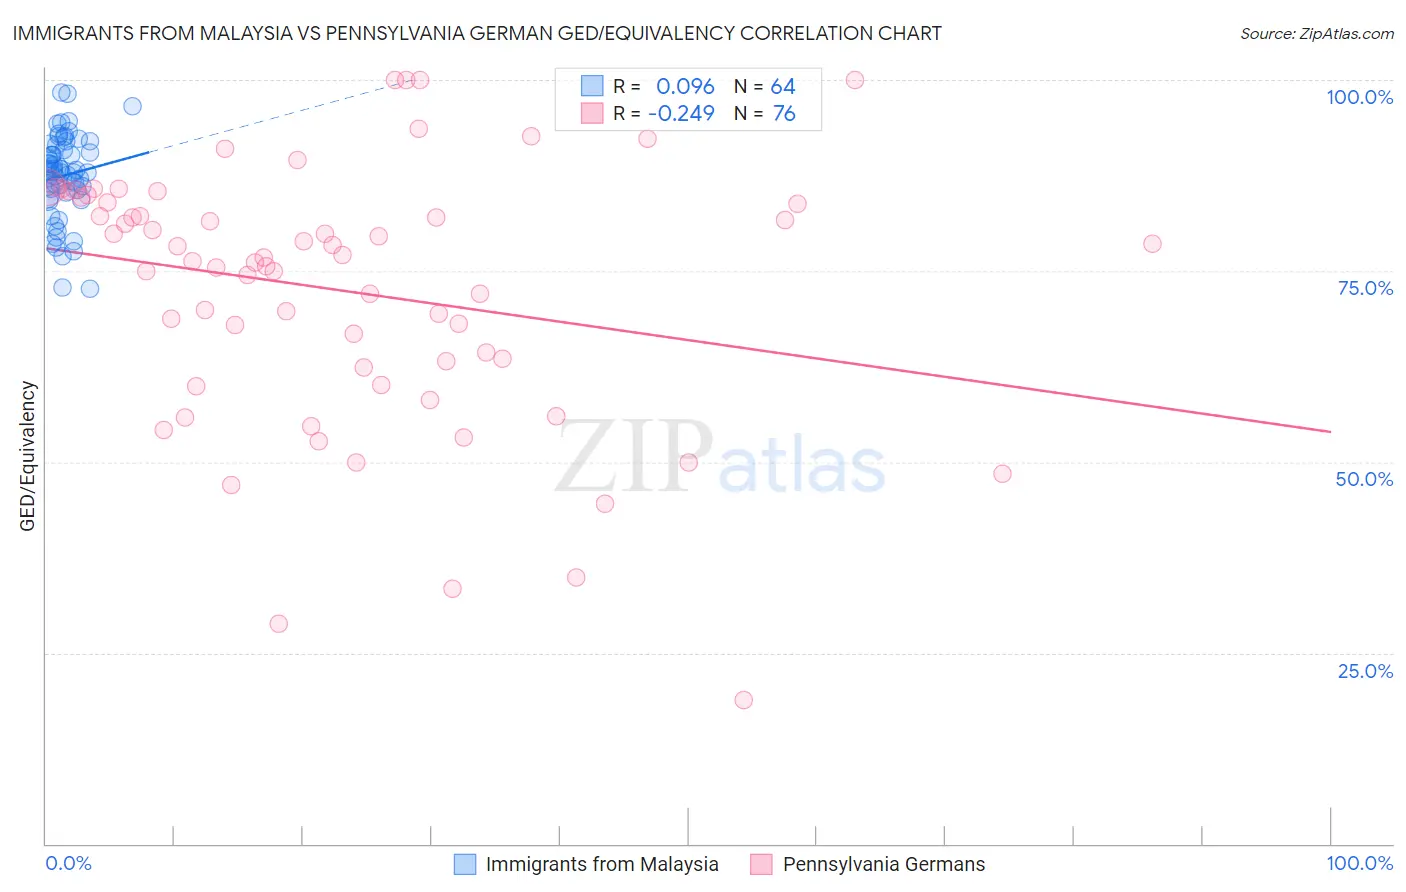
Immigrants from Malaysia vs Pennsylvania German GED/Equivalency Correlation Chart
The statistical analysis conducted on geographies consisting of 197,973,854 people shows a slight positive correlation between the proportion of Immigrants from Malaysia and percentage of population with at least ged/equivalency education in the United States with a correlation coefficient (R) of 0.096 and weighted average of 86.5%. Similarly, the statistical analysis conducted on geographies consisting of 234,102,935 people shows a weak negative correlation between the proportion of Pennsylvania Germans and percentage of population with at least ged/equivalency education in the United States with a correlation coefficient (R) of -0.249 and weighted average of 82.9%, a difference of 4.4%.
GED/Equivalency Correlation Summary
| Measurement | Immigrants from Malaysia | Pennsylvania German |
| Minimum | 72.7% | 18.8% |
| Maximum | 98.4% | 100.0% |
| Range | 25.7% | 81.2% |
| Mean | 87.5% | 72.5% |
| Median | 88.1% | 76.5% |
| Interquartile 25% (IQ1) | 85.4% | 62.8% |
| Interquartile 75% (IQ3) | 91.2% | 84.3% |
| Interquartile Range (IQR) | 5.8% | 21.5% |
| Standard Deviation (Sample) | 5.5% | 17.0% |
| Standard Deviation (Population) | 5.5% | 16.9% |
Similar Demographics by GED/Equivalency
Demographics Similar to Immigrants from Malaysia by GED/Equivalency
In terms of ged/equivalency, the demographic groups most similar to Immigrants from Malaysia are Paraguayan (86.5%, a difference of 0.030%), Immigrants from Argentina (86.6%, a difference of 0.060%), Arab (86.6%, a difference of 0.070%), Laotian (86.5%, a difference of 0.070%), and Chilean (86.6%, a difference of 0.080%).
| Demographics | Rating | Rank | GED/Equivalency |
| Immigrants | Brazil | 88.4 /100 | #132 | Excellent 86.6% |
| Tsimshian | 88.3 /100 | #133 | Excellent 86.6% |
| Albanians | 87.7 /100 | #134 | Excellent 86.6% |
| Immigrants | Asia | 87.4 /100 | #135 | Excellent 86.6% |
| Chileans | 86.9 /100 | #136 | Excellent 86.6% |
| Arabs | 86.7 /100 | #137 | Excellent 86.6% |
| Immigrants | Argentina | 86.5 /100 | #138 | Excellent 86.6% |
| Immigrants | Malaysia | 85.0 /100 | #139 | Excellent 86.5% |
| Paraguayans | 84.1 /100 | #140 | Excellent 86.5% |
| Laotians | 83.2 /100 | #141 | Excellent 86.5% |
| Immigrants | Indonesia | 82.4 /100 | #142 | Excellent 86.4% |
| Immigrants | Pakistan | 82.4 /100 | #143 | Excellent 86.4% |
| Bolivians | 82.1 /100 | #144 | Excellent 86.4% |
| Pakistanis | 80.4 /100 | #145 | Excellent 86.4% |
| Basques | 79.5 /100 | #146 | Good 86.4% |
Demographics Similar to Pennsylvania Germans by GED/Equivalency
In terms of ged/equivalency, the demographic groups most similar to Pennsylvania Germans are Barbadian (82.9%, a difference of 0.010%), Immigrants from Trinidad and Tobago (82.8%, a difference of 0.020%), U.S. Virgin Islander (82.9%, a difference of 0.050%), Seminole (82.8%, a difference of 0.080%), and Immigrants from Jamaica (82.9%, a difference of 0.090%).
| Demographics | Rating | Rank | GED/Equivalency |
| Kiowa | 0.2 /100 | #266 | Tragic 83.1% |
| Trinidadians and Tobagonians | 0.2 /100 | #267 | Tragic 83.0% |
| Immigrants | Burma/Myanmar | 0.2 /100 | #268 | Tragic 83.0% |
| Hopi | 0.2 /100 | #269 | Tragic 83.0% |
| Immigrants | Jamaica | 0.2 /100 | #270 | Tragic 82.9% |
| U.S. Virgin Islanders | 0.2 /100 | #271 | Tragic 82.9% |
| Barbadians | 0.1 /100 | #272 | Tragic 82.9% |
| Pennsylvania Germans | 0.1 /100 | #273 | Tragic 82.9% |
| Immigrants | Trinidad and Tobago | 0.1 /100 | #274 | Tragic 82.8% |
| Seminole | 0.1 /100 | #275 | Tragic 82.8% |
| Blacks/African Americans | 0.1 /100 | #276 | Tragic 82.8% |
| Arapaho | 0.1 /100 | #277 | Tragic 82.8% |
| Immigrants | Laos | 0.1 /100 | #278 | Tragic 82.7% |
| Immigrants | Fiji | 0.1 /100 | #279 | Tragic 82.7% |
| Cheyenne | 0.1 /100 | #280 | Tragic 82.7% |