Immigrants from Malaysia vs French Canadian GED/Equivalency
COMPARE
Immigrants from Malaysia
French Canadian
GED/Equivalency
GED/Equivalency Comparison
Immigrants from Malaysia
French Canadians
86.5%
GED/EQUIVALENCY
85.0/ 100
METRIC RATING
139th/ 347
METRIC RANK
86.9%
GED/EQUIVALENCY
93.2/ 100
METRIC RATING
118th/ 347
METRIC RANK
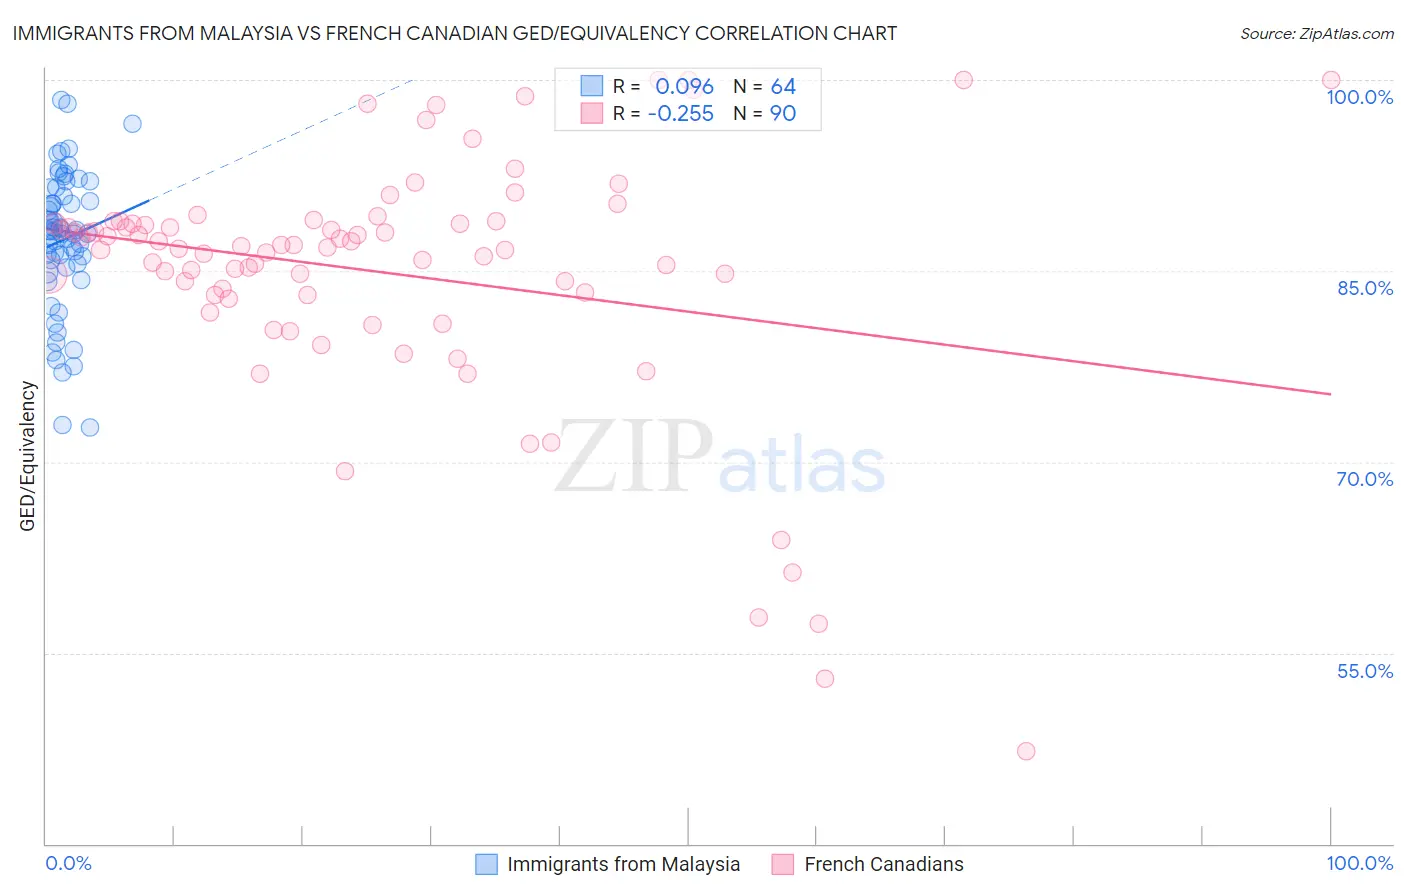
Immigrants from Malaysia vs French Canadian GED/Equivalency Correlation Chart
The statistical analysis conducted on geographies consisting of 197,973,854 people shows a slight positive correlation between the proportion of Immigrants from Malaysia and percentage of population with at least ged/equivalency education in the United States with a correlation coefficient (R) of 0.096 and weighted average of 86.5%. Similarly, the statistical analysis conducted on geographies consisting of 502,679,937 people shows a weak negative correlation between the proportion of French Canadians and percentage of population with at least ged/equivalency education in the United States with a correlation coefficient (R) of -0.255 and weighted average of 86.9%, a difference of 0.45%.
GED/Equivalency Correlation Summary
| Measurement | Immigrants from Malaysia | French Canadian |
| Minimum | 72.7% | 47.3% |
| Maximum | 98.4% | 100.0% |
| Range | 25.7% | 52.7% |
| Mean | 87.5% | 84.9% |
| Median | 88.1% | 86.9% |
| Interquartile 25% (IQ1) | 85.4% | 83.1% |
| Interquartile 75% (IQ3) | 91.2% | 88.7% |
| Interquartile Range (IQR) | 5.8% | 5.6% |
| Standard Deviation (Sample) | 5.5% | 9.8% |
| Standard Deviation (Population) | 5.5% | 9.7% |
Similar Demographics by GED/Equivalency
Demographics Similar to Immigrants from Malaysia by GED/Equivalency
In terms of ged/equivalency, the demographic groups most similar to Immigrants from Malaysia are Paraguayan (86.5%, a difference of 0.030%), Immigrants from Argentina (86.6%, a difference of 0.060%), Arab (86.6%, a difference of 0.070%), Laotian (86.5%, a difference of 0.070%), and Chilean (86.6%, a difference of 0.080%).
| Demographics | Rating | Rank | GED/Equivalency |
| Immigrants | Brazil | 88.4 /100 | #132 | Excellent 86.6% |
| Tsimshian | 88.3 /100 | #133 | Excellent 86.6% |
| Albanians | 87.7 /100 | #134 | Excellent 86.6% |
| Immigrants | Asia | 87.4 /100 | #135 | Excellent 86.6% |
| Chileans | 86.9 /100 | #136 | Excellent 86.6% |
| Arabs | 86.7 /100 | #137 | Excellent 86.6% |
| Immigrants | Argentina | 86.5 /100 | #138 | Excellent 86.6% |
| Immigrants | Malaysia | 85.0 /100 | #139 | Excellent 86.5% |
| Paraguayans | 84.1 /100 | #140 | Excellent 86.5% |
| Laotians | 83.2 /100 | #141 | Excellent 86.5% |
| Immigrants | Indonesia | 82.4 /100 | #142 | Excellent 86.4% |
| Immigrants | Pakistan | 82.4 /100 | #143 | Excellent 86.4% |
| Bolivians | 82.1 /100 | #144 | Excellent 86.4% |
| Pakistanis | 80.4 /100 | #145 | Excellent 86.4% |
| Basques | 79.5 /100 | #146 | Good 86.4% |
Demographics Similar to French Canadians by GED/Equivalency
In terms of ged/equivalency, the demographic groups most similar to French Canadians are Immigrants from China (86.9%, a difference of 0.0%), Immigrants from Hong Kong (86.9%, a difference of 0.050%), Swiss (87.0%, a difference of 0.11%), Scotch-Irish (86.8%, a difference of 0.12%), and Immigrants from Kazakhstan (87.0%, a difference of 0.13%).
| Demographics | Rating | Rank | GED/Equivalency |
| French | 95.2 /100 | #111 | Exceptional 87.1% |
| Tlingit-Haida | 94.8 /100 | #112 | Exceptional 87.0% |
| Assyrians/Chaldeans/Syriacs | 94.8 /100 | #113 | Exceptional 87.0% |
| Immigrants | Kazakhstan | 94.7 /100 | #114 | Exceptional 87.0% |
| Mongolians | 94.6 /100 | #115 | Exceptional 87.0% |
| Swiss | 94.5 /100 | #116 | Exceptional 87.0% |
| Immigrants | Hong Kong | 93.8 /100 | #117 | Exceptional 86.9% |
| French Canadians | 93.2 /100 | #118 | Exceptional 86.9% |
| Immigrants | China | 93.2 /100 | #119 | Exceptional 86.9% |
| Scotch-Irish | 91.6 /100 | #120 | Exceptional 86.8% |
| Immigrants | Lebanon | 90.9 /100 | #121 | Exceptional 86.8% |
| Immigrants | Jordan | 90.8 /100 | #122 | Exceptional 86.8% |
| Immigrants | Italy | 90.5 /100 | #123 | Exceptional 86.7% |
| Immigrants | Egypt | 90.4 /100 | #124 | Exceptional 86.7% |
| Celtics | 90.4 /100 | #125 | Exceptional 86.7% |