Immigrants from Asia vs U.S. Virgin Islander GED/Equivalency
COMPARE
Immigrants from Asia
U.S. Virgin Islander
GED/Equivalency
GED/Equivalency Comparison
Immigrants from Asia
U.S. Virgin Islanders
86.6%
GED/EQUIVALENCY
87.4/ 100
METRIC RATING
135th/ 347
METRIC RANK
82.9%
GED/EQUIVALENCY
0.2/ 100
METRIC RATING
271st/ 347
METRIC RANK
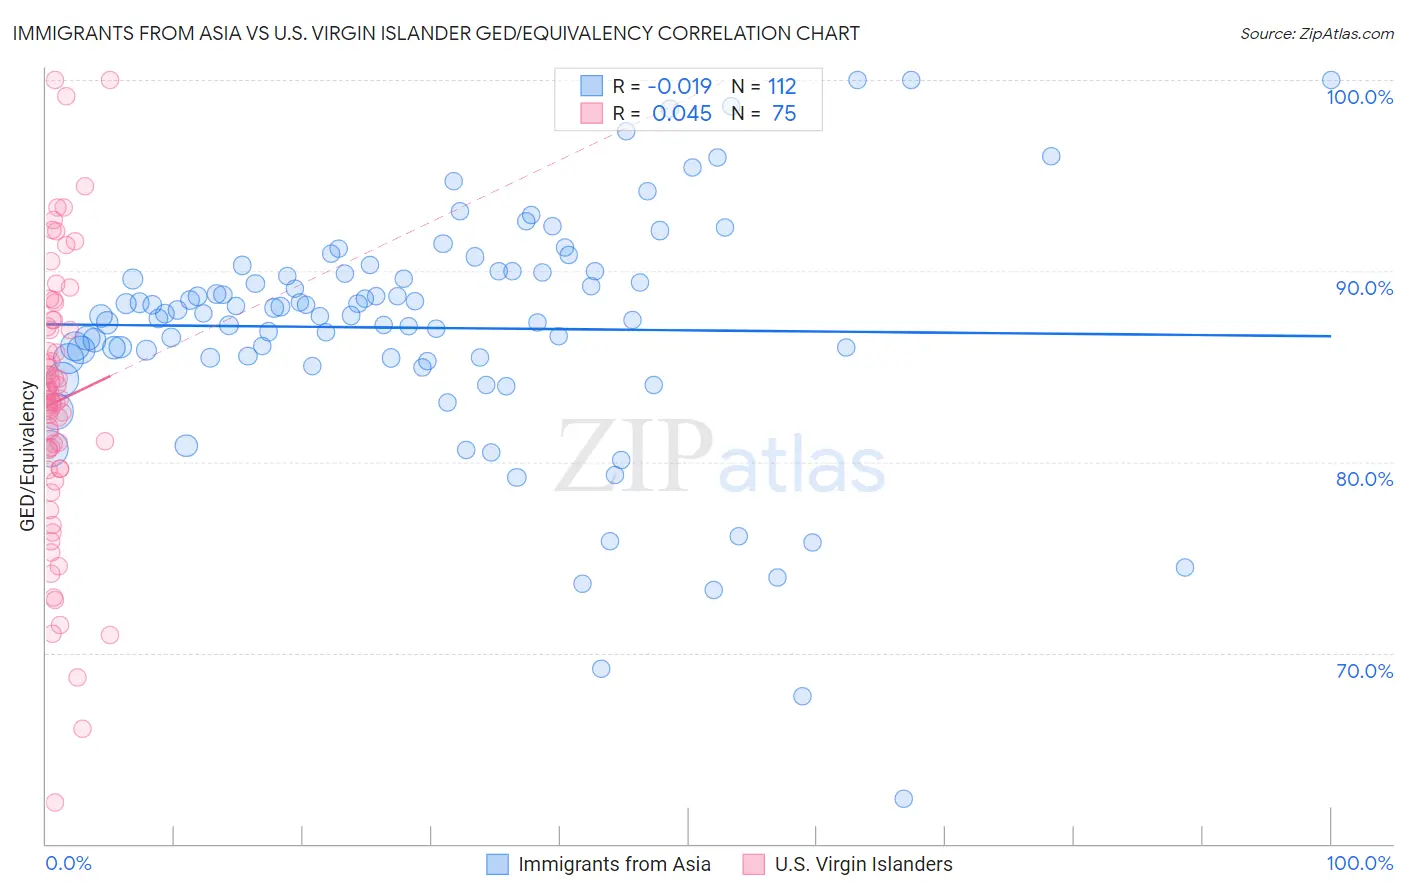
Immigrants from Asia vs U.S. Virgin Islander GED/Equivalency Correlation Chart
The statistical analysis conducted on geographies consisting of 549,170,250 people shows no correlation between the proportion of Immigrants from Asia and percentage of population with at least ged/equivalency education in the United States with a correlation coefficient (R) of -0.019 and weighted average of 86.6%. Similarly, the statistical analysis conducted on geographies consisting of 87,529,761 people shows no correlation between the proportion of U.S. Virgin Islanders and percentage of population with at least ged/equivalency education in the United States with a correlation coefficient (R) of 0.045 and weighted average of 82.9%, a difference of 4.5%.
GED/Equivalency Correlation Summary
| Measurement | Immigrants from Asia | U.S. Virgin Islander |
| Minimum | 62.4% | 62.2% |
| Maximum | 100.0% | 100.0% |
| Range | 37.6% | 37.8% |
| Mean | 87.0% | 83.2% |
| Median | 87.8% | 83.3% |
| Interquartile 25% (IQ1) | 85.4% | 79.6% |
| Interquartile 75% (IQ3) | 90.0% | 87.4% |
| Interquartile Range (IQR) | 4.5% | 7.8% |
| Standard Deviation (Sample) | 6.3% | 7.3% |
| Standard Deviation (Population) | 6.3% | 7.3% |
Similar Demographics by GED/Equivalency
Demographics Similar to Immigrants from Asia by GED/Equivalency
In terms of ged/equivalency, the demographic groups most similar to Immigrants from Asia are Albanian (86.6%, a difference of 0.010%), Chilean (86.6%, a difference of 0.020%), Arab (86.6%, a difference of 0.030%), Tsimshian (86.6%, a difference of 0.040%), and Immigrants from Argentina (86.6%, a difference of 0.040%).
| Demographics | Rating | Rank | GED/Equivalency |
| Yugoslavians | 89.5 /100 | #128 | Excellent 86.7% |
| Immigrants | Ukraine | 88.9 /100 | #129 | Excellent 86.7% |
| Immigrants | Germany | 88.8 /100 | #130 | Excellent 86.7% |
| Immigrants | Spain | 88.5 /100 | #131 | Excellent 86.7% |
| Immigrants | Brazil | 88.4 /100 | #132 | Excellent 86.6% |
| Tsimshian | 88.3 /100 | #133 | Excellent 86.6% |
| Albanians | 87.7 /100 | #134 | Excellent 86.6% |
| Immigrants | Asia | 87.4 /100 | #135 | Excellent 86.6% |
| Chileans | 86.9 /100 | #136 | Excellent 86.6% |
| Arabs | 86.7 /100 | #137 | Excellent 86.6% |
| Immigrants | Argentina | 86.5 /100 | #138 | Excellent 86.6% |
| Immigrants | Malaysia | 85.0 /100 | #139 | Excellent 86.5% |
| Paraguayans | 84.1 /100 | #140 | Excellent 86.5% |
| Laotians | 83.2 /100 | #141 | Excellent 86.5% |
| Immigrants | Indonesia | 82.4 /100 | #142 | Excellent 86.4% |
Demographics Similar to U.S. Virgin Islanders by GED/Equivalency
In terms of ged/equivalency, the demographic groups most similar to U.S. Virgin Islanders are Immigrants from Jamaica (82.9%, a difference of 0.040%), Barbadian (82.9%, a difference of 0.040%), Pennsylvania German (82.9%, a difference of 0.050%), Immigrants from Trinidad and Tobago (82.8%, a difference of 0.070%), and Hopi (83.0%, a difference of 0.090%).
| Demographics | Rating | Rank | GED/Equivalency |
| Bangladeshis | 0.2 /100 | #264 | Tragic 83.1% |
| West Indians | 0.2 /100 | #265 | Tragic 83.1% |
| Kiowa | 0.2 /100 | #266 | Tragic 83.1% |
| Trinidadians and Tobagonians | 0.2 /100 | #267 | Tragic 83.0% |
| Immigrants | Burma/Myanmar | 0.2 /100 | #268 | Tragic 83.0% |
| Hopi | 0.2 /100 | #269 | Tragic 83.0% |
| Immigrants | Jamaica | 0.2 /100 | #270 | Tragic 82.9% |
| U.S. Virgin Islanders | 0.2 /100 | #271 | Tragic 82.9% |
| Barbadians | 0.1 /100 | #272 | Tragic 82.9% |
| Pennsylvania Germans | 0.1 /100 | #273 | Tragic 82.9% |
| Immigrants | Trinidad and Tobago | 0.1 /100 | #274 | Tragic 82.8% |
| Seminole | 0.1 /100 | #275 | Tragic 82.8% |
| Blacks/African Americans | 0.1 /100 | #276 | Tragic 82.8% |
| Arapaho | 0.1 /100 | #277 | Tragic 82.8% |
| Immigrants | Laos | 0.1 /100 | #278 | Tragic 82.7% |