Immigrants from Asia vs Spanish American Indian GED/Equivalency
COMPARE
Immigrants from Asia
Spanish American Indian
GED/Equivalency
GED/Equivalency Comparison
Immigrants from Asia
Spanish American Indians
86.6%
GED/EQUIVALENCY
87.4/ 100
METRIC RATING
135th/ 347
METRIC RANK
76.3%
GED/EQUIVALENCY
0.0/ 100
METRIC RATING
344th/ 347
METRIC RANK
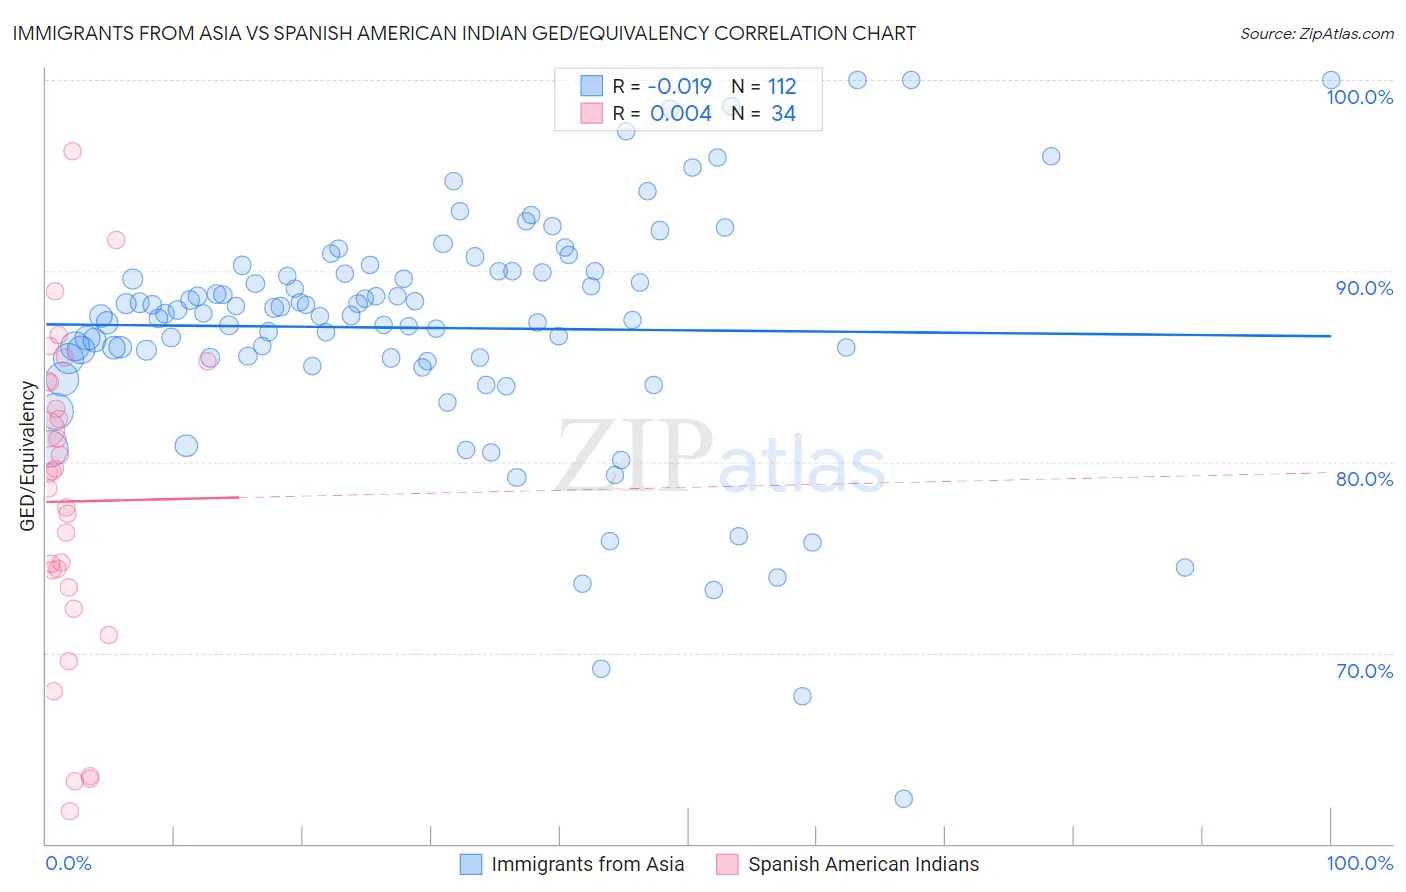
Immigrants from Asia vs Spanish American Indian GED/Equivalency Correlation Chart
The statistical analysis conducted on geographies consisting of 549,170,250 people shows no correlation between the proportion of Immigrants from Asia and percentage of population with at least ged/equivalency education in the United States with a correlation coefficient (R) of -0.019 and weighted average of 86.6%. Similarly, the statistical analysis conducted on geographies consisting of 73,147,813 people shows no correlation between the proportion of Spanish American Indians and percentage of population with at least ged/equivalency education in the United States with a correlation coefficient (R) of 0.004 and weighted average of 76.3%, a difference of 13.4%.
GED/Equivalency Correlation Summary
| Measurement | Immigrants from Asia | Spanish American Indian |
| Minimum | 62.4% | 61.7% |
| Maximum | 100.0% | 96.3% |
| Range | 37.6% | 34.6% |
| Mean | 87.0% | 77.9% |
| Median | 87.8% | 79.0% |
| Interquartile 25% (IQ1) | 85.4% | 73.4% |
| Interquartile 75% (IQ3) | 90.0% | 84.2% |
| Interquartile Range (IQR) | 4.5% | 10.8% |
| Standard Deviation (Sample) | 6.3% | 8.3% |
| Standard Deviation (Population) | 6.3% | 8.2% |
Similar Demographics by GED/Equivalency
Demographics Similar to Immigrants from Asia by GED/Equivalency
In terms of ged/equivalency, the demographic groups most similar to Immigrants from Asia are Albanian (86.6%, a difference of 0.010%), Chilean (86.6%, a difference of 0.020%), Arab (86.6%, a difference of 0.030%), Tsimshian (86.6%, a difference of 0.040%), and Immigrants from Argentina (86.6%, a difference of 0.040%).
| Demographics | Rating | Rank | GED/Equivalency |
| Yugoslavians | 89.5 /100 | #128 | Excellent 86.7% |
| Immigrants | Ukraine | 88.9 /100 | #129 | Excellent 86.7% |
| Immigrants | Germany | 88.8 /100 | #130 | Excellent 86.7% |
| Immigrants | Spain | 88.5 /100 | #131 | Excellent 86.7% |
| Immigrants | Brazil | 88.4 /100 | #132 | Excellent 86.6% |
| Tsimshian | 88.3 /100 | #133 | Excellent 86.6% |
| Albanians | 87.7 /100 | #134 | Excellent 86.6% |
| Immigrants | Asia | 87.4 /100 | #135 | Excellent 86.6% |
| Chileans | 86.9 /100 | #136 | Excellent 86.6% |
| Arabs | 86.7 /100 | #137 | Excellent 86.6% |
| Immigrants | Argentina | 86.5 /100 | #138 | Excellent 86.6% |
| Immigrants | Malaysia | 85.0 /100 | #139 | Excellent 86.5% |
| Paraguayans | 84.1 /100 | #140 | Excellent 86.5% |
| Laotians | 83.2 /100 | #141 | Excellent 86.5% |
| Immigrants | Indonesia | 82.4 /100 | #142 | Excellent 86.4% |
Demographics Similar to Spanish American Indians by GED/Equivalency
In terms of ged/equivalency, the demographic groups most similar to Spanish American Indians are Immigrants from Central America (76.4%, a difference of 0.030%), Pima (76.4%, a difference of 0.12%), Immigrants from Mexico (75.7%, a difference of 0.89%), Mexican (77.4%, a difference of 1.4%), and Tohono O'odham (77.5%, a difference of 1.5%).
| Demographics | Rating | Rank | GED/Equivalency |
| Salvadorans | 0.0 /100 | #333 | Tragic 78.6% |
| Guatemalans | 0.0 /100 | #334 | Tragic 78.5% |
| Immigrants | Latin America | 0.0 /100 | #335 | Tragic 78.5% |
| Immigrants | Dominican Republic | 0.0 /100 | #336 | Tragic 78.0% |
| Immigrants | Yemen | 0.0 /100 | #337 | Tragic 77.9% |
| Immigrants | Guatemala | 0.0 /100 | #338 | Tragic 77.9% |
| Immigrants | El Salvador | 0.0 /100 | #339 | Tragic 77.6% |
| Tohono O'odham | 0.0 /100 | #340 | Tragic 77.5% |
| Mexicans | 0.0 /100 | #341 | Tragic 77.4% |
| Pima | 0.0 /100 | #342 | Tragic 76.4% |
| Immigrants | Central America | 0.0 /100 | #343 | Tragic 76.4% |
| Spanish American Indians | 0.0 /100 | #344 | Tragic 76.3% |
| Immigrants | Mexico | 0.0 /100 | #345 | Tragic 75.7% |
| Houma | 0.0 /100 | #346 | Tragic 75.0% |
| Yakama | 0.0 /100 | #347 | Tragic 74.5% |