Immigrants from Asia vs Immigrants from England GED/Equivalency
COMPARE
Immigrants from Asia
Immigrants from England
GED/Equivalency
GED/Equivalency Comparison
Immigrants from Asia
Immigrants from England
86.6%
GED/EQUIVALENCY
87.4/ 100
METRIC RATING
135th/ 347
METRIC RANK
87.6%
GED/EQUIVALENCY
98.5/ 100
METRIC RATING
80th/ 347
METRIC RANK
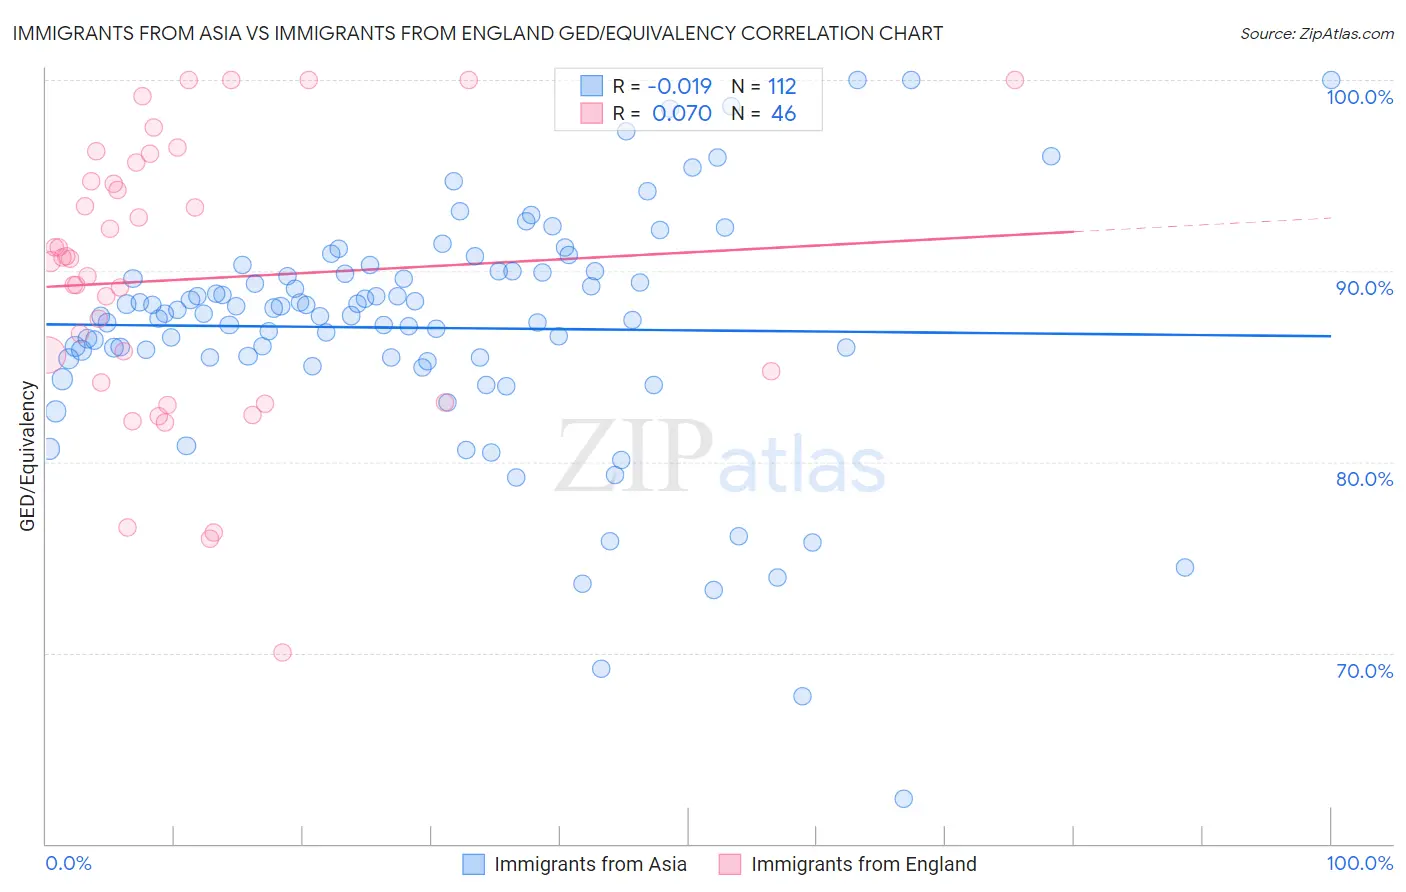
Immigrants from Asia vs Immigrants from England GED/Equivalency Correlation Chart
The statistical analysis conducted on geographies consisting of 549,170,250 people shows no correlation between the proportion of Immigrants from Asia and percentage of population with at least ged/equivalency education in the United States with a correlation coefficient (R) of -0.019 and weighted average of 86.6%. Similarly, the statistical analysis conducted on geographies consisting of 391,897,612 people shows a slight positive correlation between the proportion of Immigrants from England and percentage of population with at least ged/equivalency education in the United States with a correlation coefficient (R) of 0.070 and weighted average of 87.6%, a difference of 1.1%.
GED/Equivalency Correlation Summary
| Measurement | Immigrants from Asia | Immigrants from England |
| Minimum | 62.4% | 70.0% |
| Maximum | 100.0% | 100.0% |
| Range | 37.6% | 30.0% |
| Mean | 87.0% | 89.5% |
| Median | 87.8% | 90.6% |
| Interquartile 25% (IQ1) | 85.4% | 84.2% |
| Interquartile 75% (IQ3) | 90.0% | 94.7% |
| Interquartile Range (IQR) | 4.5% | 10.5% |
| Standard Deviation (Sample) | 6.3% | 7.2% |
| Standard Deviation (Population) | 6.3% | 7.1% |
Similar Demographics by GED/Equivalency
Demographics Similar to Immigrants from Asia by GED/Equivalency
In terms of ged/equivalency, the demographic groups most similar to Immigrants from Asia are Albanian (86.6%, a difference of 0.010%), Chilean (86.6%, a difference of 0.020%), Arab (86.6%, a difference of 0.030%), Tsimshian (86.6%, a difference of 0.040%), and Immigrants from Argentina (86.6%, a difference of 0.040%).
| Demographics | Rating | Rank | GED/Equivalency |
| Yugoslavians | 89.5 /100 | #128 | Excellent 86.7% |
| Immigrants | Ukraine | 88.9 /100 | #129 | Excellent 86.7% |
| Immigrants | Germany | 88.8 /100 | #130 | Excellent 86.7% |
| Immigrants | Spain | 88.5 /100 | #131 | Excellent 86.7% |
| Immigrants | Brazil | 88.4 /100 | #132 | Excellent 86.6% |
| Tsimshian | 88.3 /100 | #133 | Excellent 86.6% |
| Albanians | 87.7 /100 | #134 | Excellent 86.6% |
| Immigrants | Asia | 87.4 /100 | #135 | Excellent 86.6% |
| Chileans | 86.9 /100 | #136 | Excellent 86.6% |
| Arabs | 86.7 /100 | #137 | Excellent 86.6% |
| Immigrants | Argentina | 86.5 /100 | #138 | Excellent 86.6% |
| Immigrants | Malaysia | 85.0 /100 | #139 | Excellent 86.5% |
| Paraguayans | 84.1 /100 | #140 | Excellent 86.5% |
| Laotians | 83.2 /100 | #141 | Excellent 86.5% |
| Immigrants | Indonesia | 82.4 /100 | #142 | Excellent 86.4% |
Demographics Similar to Immigrants from England by GED/Equivalency
In terms of ged/equivalency, the demographic groups most similar to Immigrants from England are English (87.6%, a difference of 0.030%), Immigrants from Sri Lanka (87.5%, a difference of 0.040%), Romanian (87.5%, a difference of 0.050%), South African (87.5%, a difference of 0.050%), and Irish (87.6%, a difference of 0.060%).
| Demographics | Rating | Rank | GED/Equivalency |
| Belgians | 98.8 /100 | #73 | Exceptional 87.7% |
| Immigrants | Kuwait | 98.8 /100 | #74 | Exceptional 87.7% |
| Scottish | 98.7 /100 | #75 | Exceptional 87.7% |
| Immigrants | Serbia | 98.7 /100 | #76 | Exceptional 87.7% |
| Slavs | 98.7 /100 | #77 | Exceptional 87.7% |
| Irish | 98.6 /100 | #78 | Exceptional 87.6% |
| English | 98.6 /100 | #79 | Exceptional 87.6% |
| Immigrants | England | 98.5 /100 | #80 | Exceptional 87.6% |
| Immigrants | Sri Lanka | 98.3 /100 | #81 | Exceptional 87.5% |
| Romanians | 98.3 /100 | #82 | Exceptional 87.5% |
| South Africans | 98.3 /100 | #83 | Exceptional 87.5% |
| Immigrants | Romania | 98.1 /100 | #84 | Exceptional 87.5% |
| Dutch | 98.1 /100 | #85 | Exceptional 87.5% |
| Immigrants | Europe | 98.1 /100 | #86 | Exceptional 87.5% |
| Native Hawaiians | 98.1 /100 | #87 | Exceptional 87.5% |