Immigrants from Yemen vs U.S. Virgin Islander GED/Equivalency
COMPARE
Immigrants from Yemen
U.S. Virgin Islander
GED/Equivalency
GED/Equivalency Comparison
Immigrants from Yemen
U.S. Virgin Islanders
77.9%
GED/EQUIVALENCY
0.0/ 100
METRIC RATING
337th/ 347
METRIC RANK
82.9%
GED/EQUIVALENCY
0.2/ 100
METRIC RATING
271st/ 347
METRIC RANK
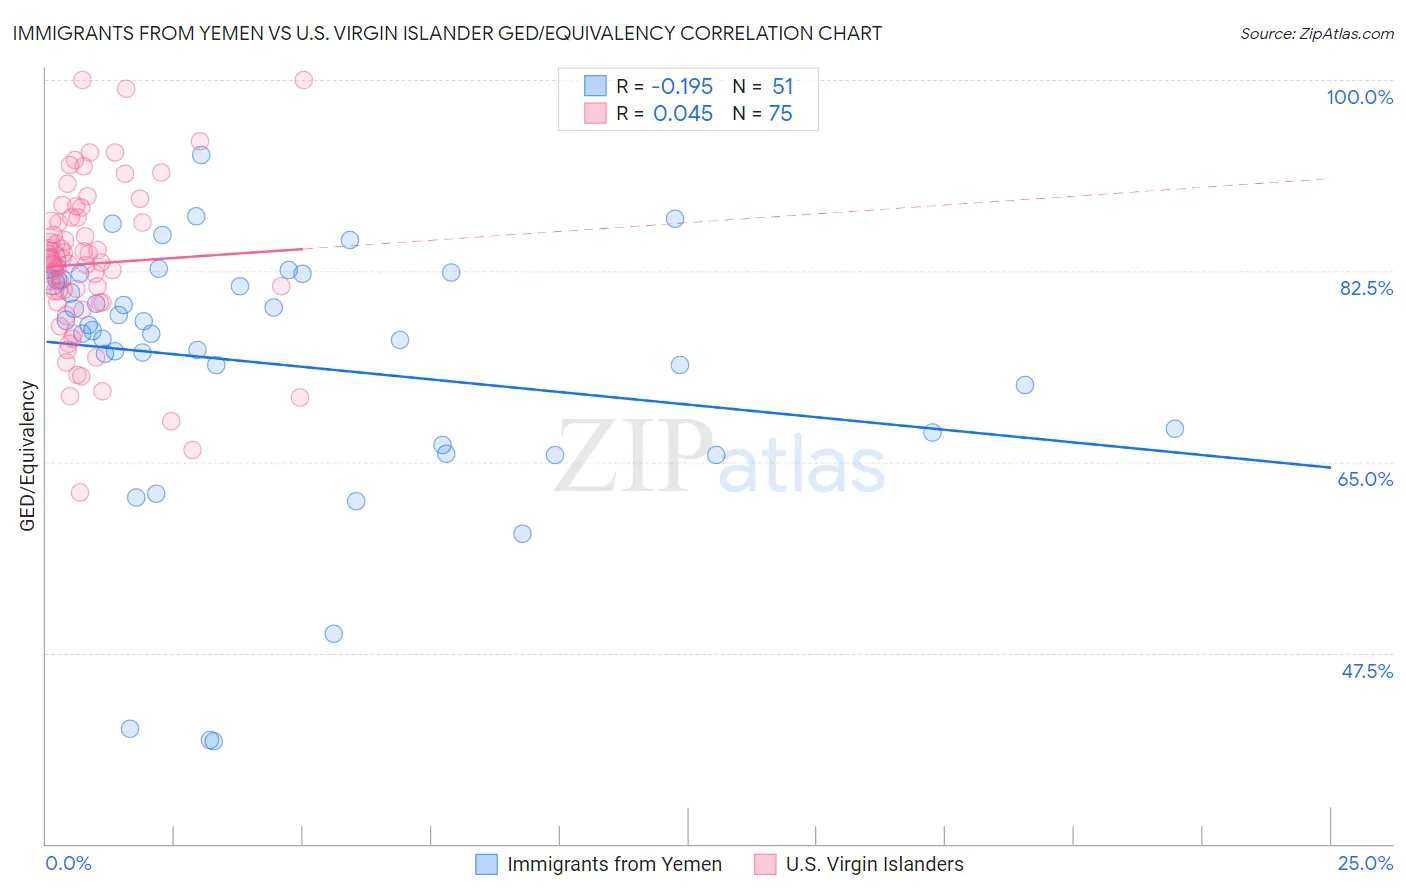
Immigrants from Yemen vs U.S. Virgin Islander GED/Equivalency Correlation Chart
The statistical analysis conducted on geographies consisting of 82,433,611 people shows a poor negative correlation between the proportion of Immigrants from Yemen and percentage of population with at least ged/equivalency education in the United States with a correlation coefficient (R) of -0.195 and weighted average of 77.9%. Similarly, the statistical analysis conducted on geographies consisting of 87,529,761 people shows no correlation between the proportion of U.S. Virgin Islanders and percentage of population with at least ged/equivalency education in the United States with a correlation coefficient (R) of 0.045 and weighted average of 82.9%, a difference of 6.4%.
GED/Equivalency Correlation Summary
| Measurement | Immigrants from Yemen | U.S. Virgin Islander |
| Minimum | 39.4% | 62.2% |
| Maximum | 93.1% | 100.0% |
| Range | 53.7% | 37.8% |
| Mean | 73.9% | 83.2% |
| Median | 77.0% | 83.3% |
| Interquartile 25% (IQ1) | 67.7% | 79.6% |
| Interquartile 75% (IQ3) | 81.8% | 87.4% |
| Interquartile Range (IQR) | 14.1% | 7.8% |
| Standard Deviation (Sample) | 12.0% | 7.3% |
| Standard Deviation (Population) | 11.9% | 7.3% |
Similar Demographics by GED/Equivalency
Demographics Similar to Immigrants from Yemen by GED/Equivalency
In terms of ged/equivalency, the demographic groups most similar to Immigrants from Yemen are Immigrants from Guatemala (77.9%, a difference of 0.020%), Immigrants from Dominican Republic (78.0%, a difference of 0.060%), Immigrants from El Salvador (77.6%, a difference of 0.41%), Tohono O'odham (77.5%, a difference of 0.56%), and Mexican (77.4%, a difference of 0.65%).
| Demographics | Rating | Rank | GED/Equivalency |
| Immigrants | Cabo Verde | 0.0 /100 | #330 | Tragic 78.9% |
| Immigrants | Honduras | 0.0 /100 | #331 | Tragic 78.7% |
| Immigrants | Azores | 0.0 /100 | #332 | Tragic 78.7% |
| Salvadorans | 0.0 /100 | #333 | Tragic 78.6% |
| Guatemalans | 0.0 /100 | #334 | Tragic 78.5% |
| Immigrants | Latin America | 0.0 /100 | #335 | Tragic 78.5% |
| Immigrants | Dominican Republic | 0.0 /100 | #336 | Tragic 78.0% |
| Immigrants | Yemen | 0.0 /100 | #337 | Tragic 77.9% |
| Immigrants | Guatemala | 0.0 /100 | #338 | Tragic 77.9% |
| Immigrants | El Salvador | 0.0 /100 | #339 | Tragic 77.6% |
| Tohono O'odham | 0.0 /100 | #340 | Tragic 77.5% |
| Mexicans | 0.0 /100 | #341 | Tragic 77.4% |
| Pima | 0.0 /100 | #342 | Tragic 76.4% |
| Immigrants | Central America | 0.0 /100 | #343 | Tragic 76.4% |
| Spanish American Indians | 0.0 /100 | #344 | Tragic 76.3% |
Demographics Similar to U.S. Virgin Islanders by GED/Equivalency
In terms of ged/equivalency, the demographic groups most similar to U.S. Virgin Islanders are Immigrants from Jamaica (82.9%, a difference of 0.040%), Barbadian (82.9%, a difference of 0.040%), Pennsylvania German (82.9%, a difference of 0.050%), Immigrants from Trinidad and Tobago (82.8%, a difference of 0.070%), and Hopi (83.0%, a difference of 0.090%).
| Demographics | Rating | Rank | GED/Equivalency |
| Bangladeshis | 0.2 /100 | #264 | Tragic 83.1% |
| West Indians | 0.2 /100 | #265 | Tragic 83.1% |
| Kiowa | 0.2 /100 | #266 | Tragic 83.1% |
| Trinidadians and Tobagonians | 0.2 /100 | #267 | Tragic 83.0% |
| Immigrants | Burma/Myanmar | 0.2 /100 | #268 | Tragic 83.0% |
| Hopi | 0.2 /100 | #269 | Tragic 83.0% |
| Immigrants | Jamaica | 0.2 /100 | #270 | Tragic 82.9% |
| U.S. Virgin Islanders | 0.2 /100 | #271 | Tragic 82.9% |
| Barbadians | 0.1 /100 | #272 | Tragic 82.9% |
| Pennsylvania Germans | 0.1 /100 | #273 | Tragic 82.9% |
| Immigrants | Trinidad and Tobago | 0.1 /100 | #274 | Tragic 82.8% |
| Seminole | 0.1 /100 | #275 | Tragic 82.8% |
| Blacks/African Americans | 0.1 /100 | #276 | Tragic 82.8% |
| Arapaho | 0.1 /100 | #277 | Tragic 82.8% |
| Immigrants | Laos | 0.1 /100 | #278 | Tragic 82.7% |