Immigrants from Asia vs Immigrants from Iraq GED/Equivalency
COMPARE
Immigrants from Asia
Immigrants from Iraq
GED/Equivalency
GED/Equivalency Comparison
Immigrants from Asia
Immigrants from Iraq
86.6%
GED/EQUIVALENCY
87.4/ 100
METRIC RATING
135th/ 347
METRIC RANK
86.1%
GED/EQUIVALENCY
68.1/ 100
METRIC RATING
162nd/ 347
METRIC RANK
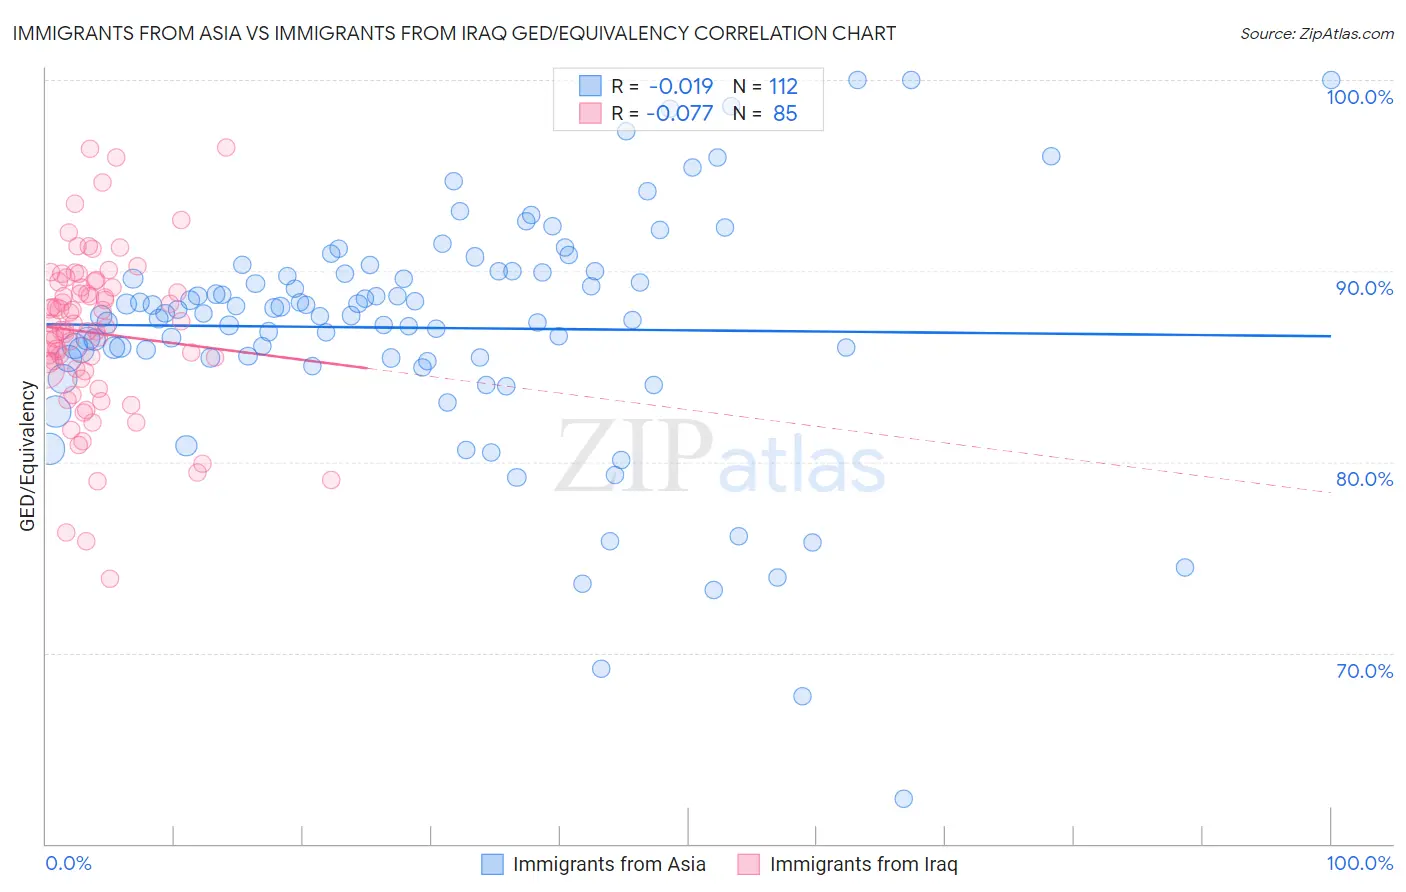
Immigrants from Asia vs Immigrants from Iraq GED/Equivalency Correlation Chart
The statistical analysis conducted on geographies consisting of 549,170,250 people shows no correlation between the proportion of Immigrants from Asia and percentage of population with at least ged/equivalency education in the United States with a correlation coefficient (R) of -0.019 and weighted average of 86.6%. Similarly, the statistical analysis conducted on geographies consisting of 194,780,026 people shows a slight negative correlation between the proportion of Immigrants from Iraq and percentage of population with at least ged/equivalency education in the United States with a correlation coefficient (R) of -0.077 and weighted average of 86.1%, a difference of 0.60%.
GED/Equivalency Correlation Summary
| Measurement | Immigrants from Asia | Immigrants from Iraq |
| Minimum | 62.4% | 73.9% |
| Maximum | 100.0% | 96.5% |
| Range | 37.6% | 22.6% |
| Mean | 87.0% | 86.7% |
| Median | 87.8% | 87.0% |
| Interquartile 25% (IQ1) | 85.4% | 84.8% |
| Interquartile 75% (IQ3) | 90.0% | 89.3% |
| Interquartile Range (IQR) | 4.5% | 4.5% |
| Standard Deviation (Sample) | 6.3% | 4.3% |
| Standard Deviation (Population) | 6.3% | 4.3% |
Similar Demographics by GED/Equivalency
Demographics Similar to Immigrants from Asia by GED/Equivalency
In terms of ged/equivalency, the demographic groups most similar to Immigrants from Asia are Albanian (86.6%, a difference of 0.010%), Chilean (86.6%, a difference of 0.020%), Arab (86.6%, a difference of 0.030%), Tsimshian (86.6%, a difference of 0.040%), and Immigrants from Argentina (86.6%, a difference of 0.040%).
| Demographics | Rating | Rank | GED/Equivalency |
| Yugoslavians | 89.5 /100 | #128 | Excellent 86.7% |
| Immigrants | Ukraine | 88.9 /100 | #129 | Excellent 86.7% |
| Immigrants | Germany | 88.8 /100 | #130 | Excellent 86.7% |
| Immigrants | Spain | 88.5 /100 | #131 | Excellent 86.7% |
| Immigrants | Brazil | 88.4 /100 | #132 | Excellent 86.6% |
| Tsimshian | 88.3 /100 | #133 | Excellent 86.6% |
| Albanians | 87.7 /100 | #134 | Excellent 86.6% |
| Immigrants | Asia | 87.4 /100 | #135 | Excellent 86.6% |
| Chileans | 86.9 /100 | #136 | Excellent 86.6% |
| Arabs | 86.7 /100 | #137 | Excellent 86.6% |
| Immigrants | Argentina | 86.5 /100 | #138 | Excellent 86.6% |
| Immigrants | Malaysia | 85.0 /100 | #139 | Excellent 86.5% |
| Paraguayans | 84.1 /100 | #140 | Excellent 86.5% |
| Laotians | 83.2 /100 | #141 | Excellent 86.5% |
| Immigrants | Indonesia | 82.4 /100 | #142 | Excellent 86.4% |
Demographics Similar to Immigrants from Iraq by GED/Equivalency
In terms of ged/equivalency, the demographic groups most similar to Immigrants from Iraq are Immigrants from Morocco (86.1%, a difference of 0.030%), Immigrants from Syria (86.1%, a difference of 0.030%), Ugandan (86.1%, a difference of 0.040%), Venezuelan (86.0%, a difference of 0.060%), and Immigrants from Kenya (86.2%, a difference of 0.090%).
| Demographics | Rating | Rank | GED/Equivalency |
| Iraqis | 75.2 /100 | #155 | Good 86.2% |
| Immigrants | Nepal | 73.3 /100 | #156 | Good 86.2% |
| Whites/Caucasians | 72.2 /100 | #157 | Good 86.2% |
| German Russians | 72.1 /100 | #158 | Good 86.2% |
| Immigrants | Kenya | 71.8 /100 | #159 | Good 86.2% |
| Immigrants | Morocco | 69.5 /100 | #160 | Good 86.1% |
| Immigrants | Syria | 69.3 /100 | #161 | Good 86.1% |
| Immigrants | Iraq | 68.1 /100 | #162 | Good 86.1% |
| Ugandans | 66.3 /100 | #163 | Good 86.1% |
| Venezuelans | 65.5 /100 | #164 | Good 86.0% |
| Alsatians | 64.3 /100 | #165 | Good 86.0% |
| Immigrants | Albania | 64.2 /100 | #166 | Good 86.0% |
| Ethiopians | 63.7 /100 | #167 | Good 86.0% |
| Sierra Leoneans | 61.8 /100 | #168 | Good 86.0% |
| Immigrants | Ethiopia | 61.2 /100 | #169 | Good 86.0% |