Immigrants from Asia vs Delaware GED/Equivalency
COMPARE
Immigrants from Asia
Delaware
GED/Equivalency
GED/Equivalency Comparison
Immigrants from Asia
Delaware
86.6%
GED/EQUIVALENCY
87.4/ 100
METRIC RATING
135th/ 347
METRIC RANK
85.2%
GED/EQUIVALENCY
22.2/ 100
METRIC RATING
193rd/ 347
METRIC RANK
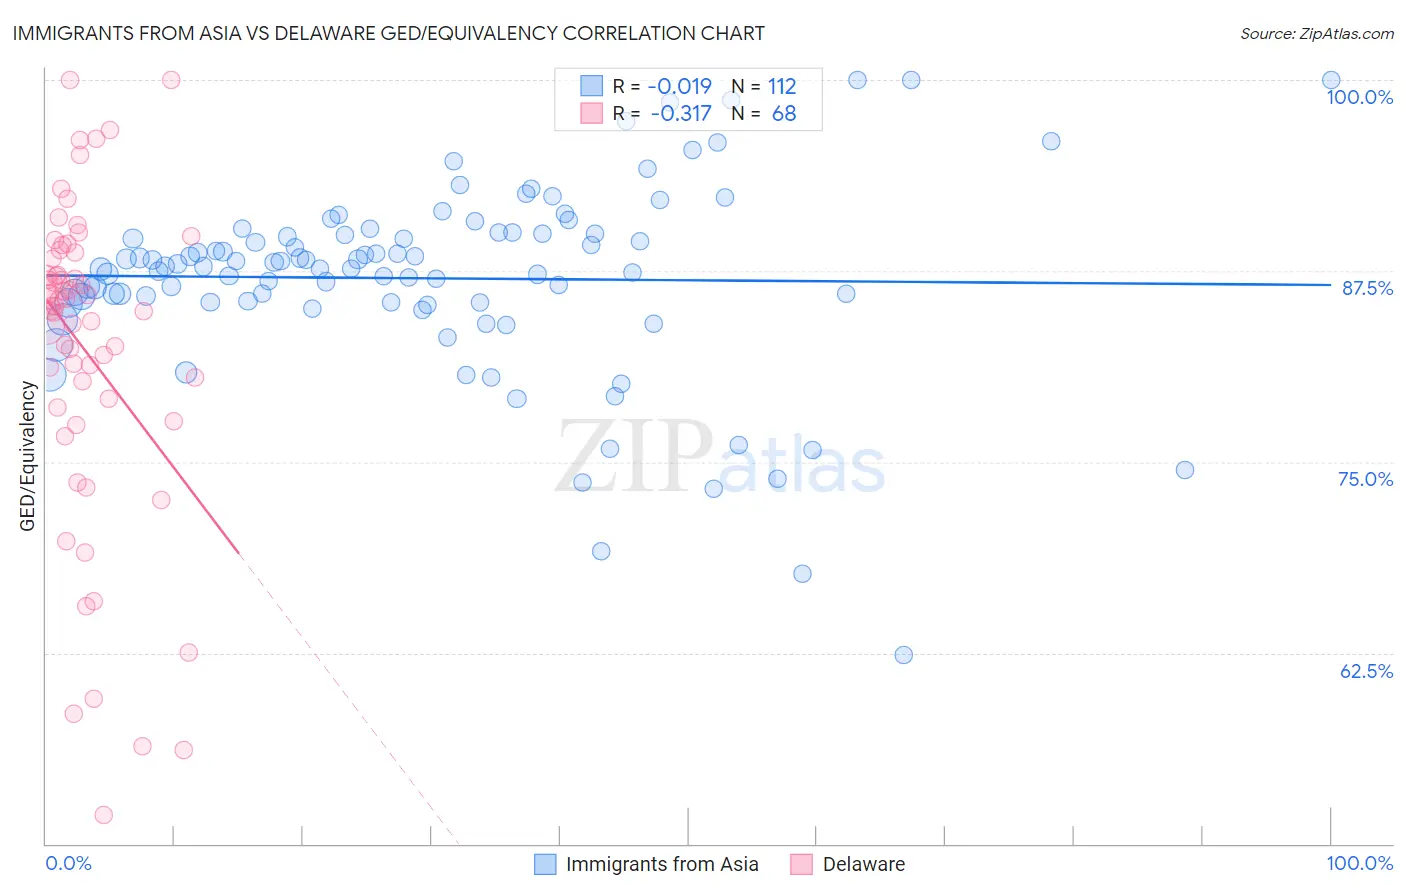
Immigrants from Asia vs Delaware GED/Equivalency Correlation Chart
The statistical analysis conducted on geographies consisting of 549,170,250 people shows no correlation between the proportion of Immigrants from Asia and percentage of population with at least ged/equivalency education in the United States with a correlation coefficient (R) of -0.019 and weighted average of 86.6%. Similarly, the statistical analysis conducted on geographies consisting of 96,235,398 people shows a mild negative correlation between the proportion of Delaware and percentage of population with at least ged/equivalency education in the United States with a correlation coefficient (R) of -0.317 and weighted average of 85.2%, a difference of 1.7%.
GED/Equivalency Correlation Summary
| Measurement | Immigrants from Asia | Delaware |
| Minimum | 62.4% | 51.9% |
| Maximum | 100.0% | 100.0% |
| Range | 37.6% | 48.1% |
| Mean | 87.0% | 82.3% |
| Median | 87.8% | 85.2% |
| Interquartile 25% (IQ1) | 85.4% | 78.8% |
| Interquartile 75% (IQ3) | 90.0% | 88.5% |
| Interquartile Range (IQR) | 4.5% | 9.7% |
| Standard Deviation (Sample) | 6.3% | 10.5% |
| Standard Deviation (Population) | 6.3% | 10.5% |
Similar Demographics by GED/Equivalency
Demographics Similar to Immigrants from Asia by GED/Equivalency
In terms of ged/equivalency, the demographic groups most similar to Immigrants from Asia are Albanian (86.6%, a difference of 0.010%), Chilean (86.6%, a difference of 0.020%), Arab (86.6%, a difference of 0.030%), Tsimshian (86.6%, a difference of 0.040%), and Immigrants from Argentina (86.6%, a difference of 0.040%).
| Demographics | Rating | Rank | GED/Equivalency |
| Yugoslavians | 89.5 /100 | #128 | Excellent 86.7% |
| Immigrants | Ukraine | 88.9 /100 | #129 | Excellent 86.7% |
| Immigrants | Germany | 88.8 /100 | #130 | Excellent 86.7% |
| Immigrants | Spain | 88.5 /100 | #131 | Excellent 86.7% |
| Immigrants | Brazil | 88.4 /100 | #132 | Excellent 86.6% |
| Tsimshian | 88.3 /100 | #133 | Excellent 86.6% |
| Albanians | 87.7 /100 | #134 | Excellent 86.6% |
| Immigrants | Asia | 87.4 /100 | #135 | Excellent 86.6% |
| Chileans | 86.9 /100 | #136 | Excellent 86.6% |
| Arabs | 86.7 /100 | #137 | Excellent 86.6% |
| Immigrants | Argentina | 86.5 /100 | #138 | Excellent 86.6% |
| Immigrants | Malaysia | 85.0 /100 | #139 | Excellent 86.5% |
| Paraguayans | 84.1 /100 | #140 | Excellent 86.5% |
| Laotians | 83.2 /100 | #141 | Excellent 86.5% |
| Immigrants | Indonesia | 82.4 /100 | #142 | Excellent 86.4% |
Demographics Similar to Delaware by GED/Equivalency
In terms of ged/equivalency, the demographic groups most similar to Delaware are Nonimmigrants (85.2%, a difference of 0.010%), South American Indian (85.2%, a difference of 0.020%), Puget Sound Salish (85.2%, a difference of 0.040%), Chippewa (85.2%, a difference of 0.040%), and Tongan (85.2%, a difference of 0.050%).
| Demographics | Rating | Rank | GED/Equivalency |
| Spaniards | 31.9 /100 | #186 | Fair 85.4% |
| Immigrants | Afghanistan | 29.8 /100 | #187 | Fair 85.4% |
| Immigrants | Sierra Leone | 29.0 /100 | #188 | Fair 85.4% |
| Guamanians/Chamorros | 28.4 /100 | #189 | Fair 85.3% |
| Alaskan Athabascans | 27.5 /100 | #190 | Fair 85.3% |
| South American Indians | 22.8 /100 | #191 | Fair 85.2% |
| Immigrants | Nonimmigrants | 22.7 /100 | #192 | Fair 85.2% |
| Delaware | 22.2 /100 | #193 | Fair 85.2% |
| Puget Sound Salish | 20.8 /100 | #194 | Fair 85.2% |
| Chippewa | 20.8 /100 | #195 | Fair 85.2% |
| Tongans | 20.7 /100 | #196 | Fair 85.2% |
| Costa Ricans | 20.4 /100 | #197 | Fair 85.2% |
| Immigrants | Africa | 17.5 /100 | #198 | Poor 85.1% |
| Somalis | 16.4 /100 | #199 | Poor 85.0% |
| Uruguayans | 16.0 /100 | #200 | Poor 85.0% |