Immigrants from Asia vs U.S. Virgin Islander 8th Grade
COMPARE
Immigrants from Asia
U.S. Virgin Islander
8th Grade
8th Grade Comparison
Immigrants from Asia
U.S. Virgin Islanders
95.2%
8TH GRADE
3.1/ 100
METRIC RATING
233rd/ 347
METRIC RANK
95.0%
8TH GRADE
0.9/ 100
METRIC RATING
253rd/ 347
METRIC RANK
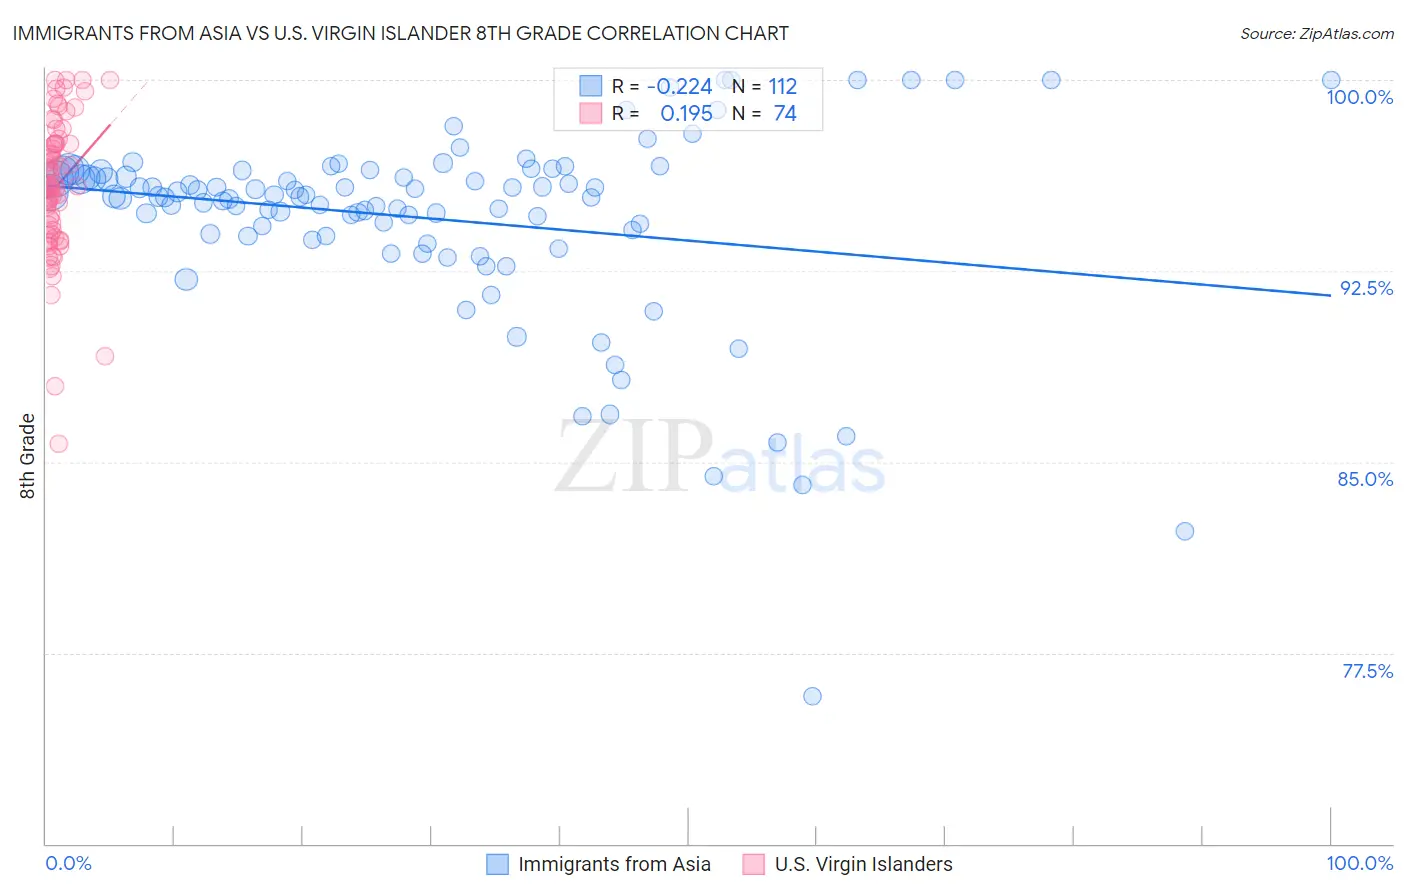
Immigrants from Asia vs U.S. Virgin Islander 8th Grade Correlation Chart
The statistical analysis conducted on geographies consisting of 549,167,442 people shows a weak negative correlation between the proportion of Immigrants from Asia and percentage of population with at least 8th grade education in the United States with a correlation coefficient (R) of -0.224 and weighted average of 95.2%. Similarly, the statistical analysis conducted on geographies consisting of 87,529,315 people shows a poor positive correlation between the proportion of U.S. Virgin Islanders and percentage of population with at least 8th grade education in the United States with a correlation coefficient (R) of 0.195 and weighted average of 95.0%, a difference of 0.20%.
8th Grade Correlation Summary
| Measurement | Immigrants from Asia | U.S. Virgin Islander |
| Minimum | 75.8% | 85.7% |
| Maximum | 100.0% | 100.0% |
| Range | 24.2% | 14.3% |
| Mean | 94.6% | 95.8% |
| Median | 95.4% | 95.9% |
| Interquartile 25% (IQ1) | 93.9% | 94.1% |
| Interquartile 75% (IQ3) | 96.4% | 97.5% |
| Interquartile Range (IQR) | 2.5% | 3.4% |
| Standard Deviation (Sample) | 3.8% | 2.7% |
| Standard Deviation (Population) | 3.8% | 2.7% |
Demographics Similar to Immigrants from Asia and U.S. Virgin Islanders by 8th Grade
In terms of 8th grade, the demographic groups most similar to Immigrants from Asia are Costa Rican (95.2%, a difference of 0.0%), Nigerian (95.2%, a difference of 0.010%), Senegalese (95.2%, a difference of 0.020%), Immigrants from Africa (95.2%, a difference of 0.020%), and Native/Alaskan (95.2%, a difference of 0.050%). Similarly, the demographic groups most similar to U.S. Virgin Islanders are Bolivian (95.0%, a difference of 0.010%), Immigrants from Ethiopia (95.0%, a difference of 0.010%), Korean (95.0%, a difference of 0.020%), Immigrants from China (95.0%, a difference of 0.030%), and Uruguayan (95.1%, a difference of 0.050%).
| Demographics | Rating | Rank | 8th Grade |
| Immigrants | Asia | 3.1 /100 | #233 | Tragic 95.2% |
| Costa Ricans | 3.0 /100 | #234 | Tragic 95.2% |
| Nigerians | 2.9 /100 | #235 | Tragic 95.2% |
| Senegalese | 2.7 /100 | #236 | Tragic 95.2% |
| Immigrants | Africa | 2.7 /100 | #237 | Tragic 95.2% |
| Natives/Alaskans | 2.3 /100 | #238 | Tragic 95.2% |
| Immigrants | Sierra Leone | 2.1 /100 | #239 | Tragic 95.1% |
| Ethiopians | 2.0 /100 | #240 | Tragic 95.1% |
| South American Indians | 1.9 /100 | #241 | Tragic 95.1% |
| Tongans | 1.7 /100 | #242 | Tragic 95.1% |
| Paiute | 1.7 /100 | #243 | Tragic 95.1% |
| Immigrants | Middle Africa | 1.7 /100 | #244 | Tragic 95.1% |
| Jamaicans | 1.4 /100 | #245 | Tragic 95.1% |
| Somalis | 1.4 /100 | #246 | Tragic 95.1% |
| Immigrants | Senegal | 1.4 /100 | #247 | Tragic 95.1% |
| Uruguayans | 1.2 /100 | #248 | Tragic 95.1% |
| Immigrants | China | 1.1 /100 | #249 | Tragic 95.0% |
| Koreans | 1.1 /100 | #250 | Tragic 95.0% |
| Bolivians | 1.0 /100 | #251 | Tragic 95.0% |
| Immigrants | Ethiopia | 1.0 /100 | #252 | Tragic 95.0% |
| U.S. Virgin Islanders | 0.9 /100 | #253 | Tragic 95.0% |