Immigrants from Asia vs Immigrants from Hong Kong GED/Equivalency
COMPARE
Immigrants from Asia
Immigrants from Hong Kong
GED/Equivalency
GED/Equivalency Comparison
Immigrants from Asia
Immigrants from Hong Kong
86.6%
GED/EQUIVALENCY
87.4/ 100
METRIC RATING
135th/ 347
METRIC RANK
86.9%
GED/EQUIVALENCY
93.8/ 100
METRIC RATING
117th/ 347
METRIC RANK
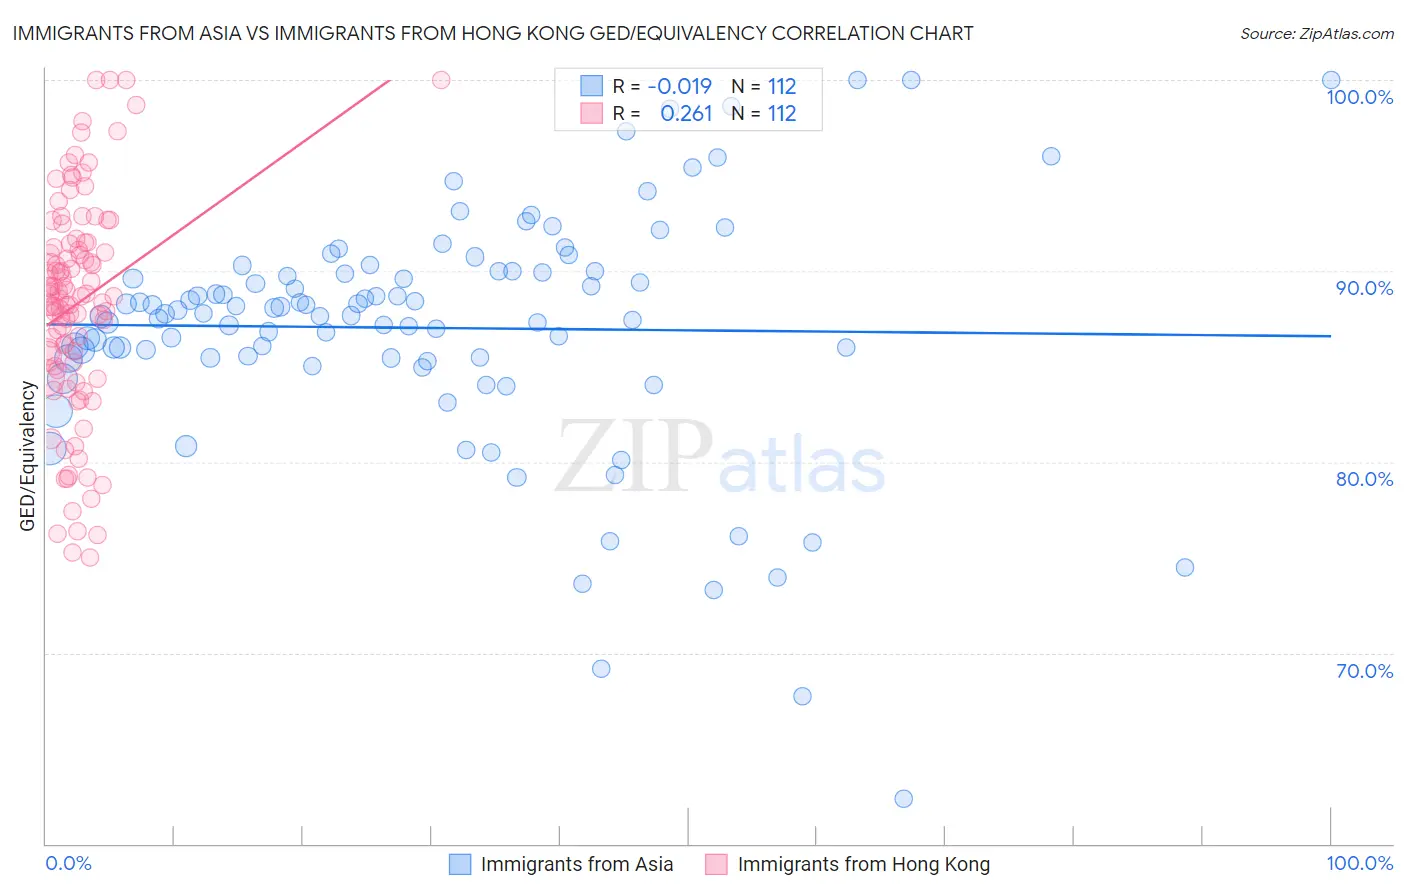
Immigrants from Asia vs Immigrants from Hong Kong GED/Equivalency Correlation Chart
The statistical analysis conducted on geographies consisting of 549,170,250 people shows no correlation between the proportion of Immigrants from Asia and percentage of population with at least ged/equivalency education in the United States with a correlation coefficient (R) of -0.019 and weighted average of 86.6%. Similarly, the statistical analysis conducted on geographies consisting of 253,990,250 people shows a weak positive correlation between the proportion of Immigrants from Hong Kong and percentage of population with at least ged/equivalency education in the United States with a correlation coefficient (R) of 0.261 and weighted average of 86.9%, a difference of 0.39%.
GED/Equivalency Correlation Summary
| Measurement | Immigrants from Asia | Immigrants from Hong Kong |
| Minimum | 62.4% | 75.0% |
| Maximum | 100.0% | 100.0% |
| Range | 37.6% | 25.0% |
| Mean | 87.0% | 88.3% |
| Median | 87.8% | 88.7% |
| Interquartile 25% (IQ1) | 85.4% | 85.1% |
| Interquartile 75% (IQ3) | 90.0% | 91.4% |
| Interquartile Range (IQR) | 4.5% | 6.3% |
| Standard Deviation (Sample) | 6.3% | 5.7% |
| Standard Deviation (Population) | 6.3% | 5.7% |
Demographics Similar to Immigrants from Asia and Immigrants from Hong Kong by GED/Equivalency
In terms of ged/equivalency, the demographic groups most similar to Immigrants from Asia are Albanian (86.6%, a difference of 0.010%), Chilean (86.6%, a difference of 0.020%), Tsimshian (86.6%, a difference of 0.040%), Immigrants from Spain (86.7%, a difference of 0.050%), and Immigrants from Brazil (86.6%, a difference of 0.050%). Similarly, the demographic groups most similar to Immigrants from Hong Kong are French Canadian (86.9%, a difference of 0.050%), Immigrants from China (86.9%, a difference of 0.050%), Swiss (87.0%, a difference of 0.070%), Scotch-Irish (86.8%, a difference of 0.16%), and Immigrants from Lebanon (86.8%, a difference of 0.21%).
| Demographics | Rating | Rank | GED/Equivalency |
| Swiss | 94.5 /100 | #116 | Exceptional 87.0% |
| Immigrants | Hong Kong | 93.8 /100 | #117 | Exceptional 86.9% |
| French Canadians | 93.2 /100 | #118 | Exceptional 86.9% |
| Immigrants | China | 93.2 /100 | #119 | Exceptional 86.9% |
| Scotch-Irish | 91.6 /100 | #120 | Exceptional 86.8% |
| Immigrants | Lebanon | 90.9 /100 | #121 | Exceptional 86.8% |
| Immigrants | Jordan | 90.8 /100 | #122 | Exceptional 86.8% |
| Immigrants | Italy | 90.5 /100 | #123 | Exceptional 86.7% |
| Immigrants | Egypt | 90.4 /100 | #124 | Exceptional 86.7% |
| Celtics | 90.4 /100 | #125 | Exceptional 86.7% |
| Asians | 90.3 /100 | #126 | Exceptional 86.7% |
| Argentineans | 89.7 /100 | #127 | Excellent 86.7% |
| Yugoslavians | 89.5 /100 | #128 | Excellent 86.7% |
| Immigrants | Ukraine | 88.9 /100 | #129 | Excellent 86.7% |
| Immigrants | Germany | 88.8 /100 | #130 | Excellent 86.7% |
| Immigrants | Spain | 88.5 /100 | #131 | Excellent 86.7% |
| Immigrants | Brazil | 88.4 /100 | #132 | Excellent 86.6% |
| Tsimshian | 88.3 /100 | #133 | Excellent 86.6% |
| Albanians | 87.7 /100 | #134 | Excellent 86.6% |
| Immigrants | Asia | 87.4 /100 | #135 | Excellent 86.6% |
| Chileans | 86.9 /100 | #136 | Excellent 86.6% |