Paiute vs U.S. Virgin Islander GED/Equivalency
COMPARE
Paiute
U.S. Virgin Islander
GED/Equivalency
GED/Equivalency Comparison
Paiute
U.S. Virgin Islanders
82.0%
GED/EQUIVALENCY
0.0/ 100
METRIC RATING
292nd/ 347
METRIC RANK
82.9%
GED/EQUIVALENCY
0.2/ 100
METRIC RATING
271st/ 347
METRIC RANK
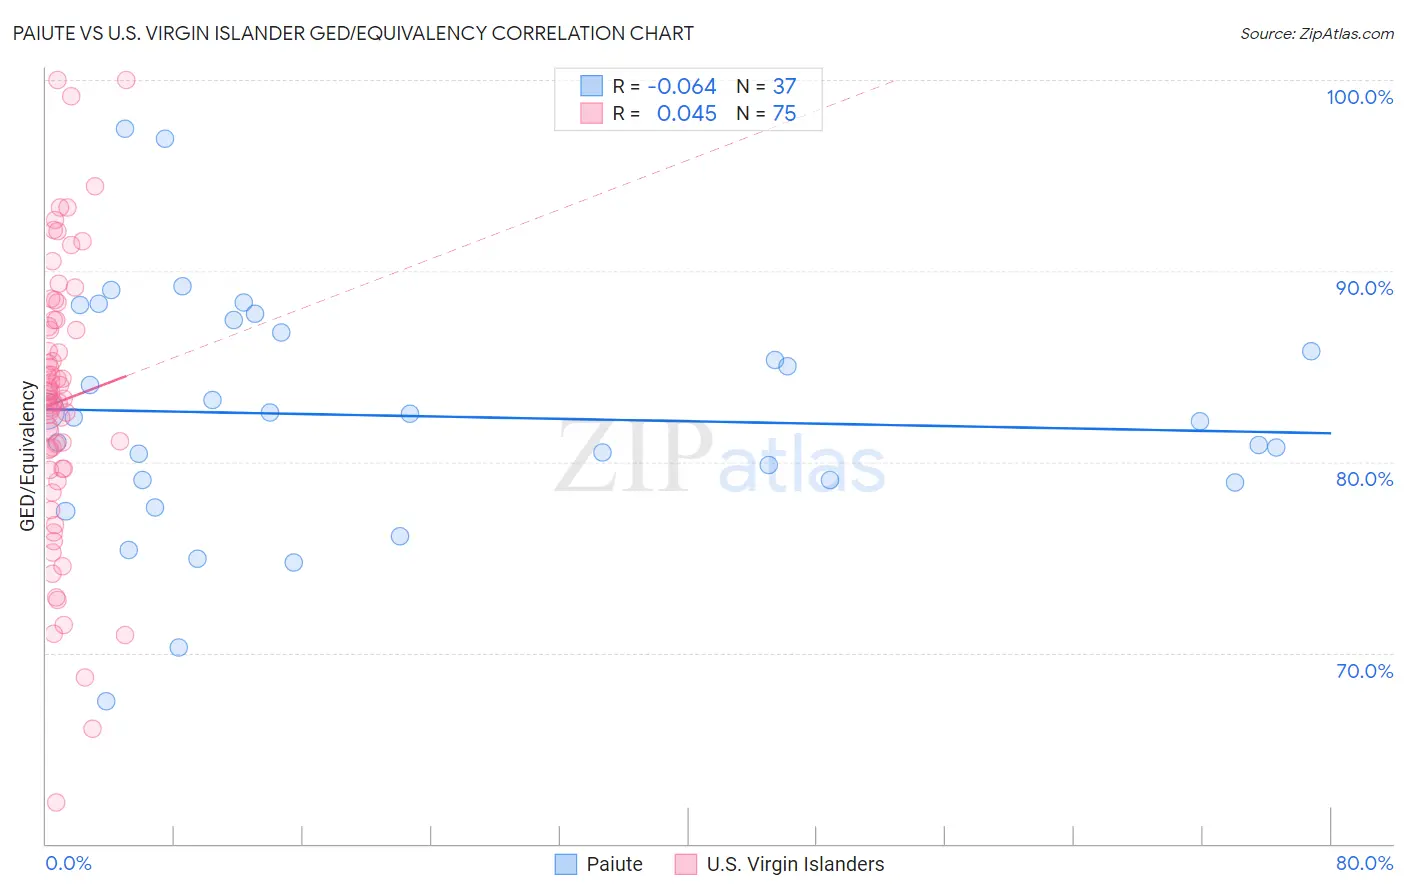
Paiute vs U.S. Virgin Islander GED/Equivalency Correlation Chart
The statistical analysis conducted on geographies consisting of 58,404,221 people shows a slight negative correlation between the proportion of Paiute and percentage of population with at least ged/equivalency education in the United States with a correlation coefficient (R) of -0.064 and weighted average of 82.0%. Similarly, the statistical analysis conducted on geographies consisting of 87,529,761 people shows no correlation between the proportion of U.S. Virgin Islanders and percentage of population with at least ged/equivalency education in the United States with a correlation coefficient (R) of 0.045 and weighted average of 82.9%, a difference of 1.1%.
GED/Equivalency Correlation Summary
| Measurement | Paiute | U.S. Virgin Islander |
| Minimum | 67.5% | 62.2% |
| Maximum | 97.4% | 100.0% |
| Range | 29.9% | 37.8% |
| Mean | 82.4% | 83.2% |
| Median | 82.3% | 83.3% |
| Interquartile 25% (IQ1) | 79.0% | 79.6% |
| Interquartile 75% (IQ3) | 87.1% | 87.4% |
| Interquartile Range (IQR) | 8.1% | 7.8% |
| Standard Deviation (Sample) | 6.3% | 7.3% |
| Standard Deviation (Population) | 6.2% | 7.3% |
Similar Demographics by GED/Equivalency
Demographics Similar to Paiute by GED/Equivalency
In terms of ged/equivalency, the demographic groups most similar to Paiute are British West Indian (82.0%, a difference of 0.010%), Immigrants from St. Vincent and the Grenadines (82.0%, a difference of 0.030%), Cuban (82.0%, a difference of 0.040%), Haitian (82.1%, a difference of 0.060%), and Nepalese (81.9%, a difference of 0.090%).
| Demographics | Rating | Rank | GED/Equivalency |
| Cajuns | 0.0 /100 | #285 | Tragic 82.4% |
| Immigrants | West Indies | 0.0 /100 | #286 | Tragic 82.4% |
| Japanese | 0.0 /100 | #287 | Tragic 82.4% |
| Pueblo | 0.0 /100 | #288 | Tragic 82.3% |
| Immigrants | Cambodia | 0.0 /100 | #289 | Tragic 82.2% |
| Haitians | 0.0 /100 | #290 | Tragic 82.1% |
| Cubans | 0.0 /100 | #291 | Tragic 82.0% |
| Paiute | 0.0 /100 | #292 | Tragic 82.0% |
| British West Indians | 0.0 /100 | #293 | Tragic 82.0% |
| Immigrants | St. Vincent and the Grenadines | 0.0 /100 | #294 | Tragic 82.0% |
| Nepalese | 0.0 /100 | #295 | Tragic 81.9% |
| Vietnamese | 0.0 /100 | #296 | Tragic 81.9% |
| Immigrants | Bangladesh | 0.0 /100 | #297 | Tragic 81.9% |
| Ute | 0.0 /100 | #298 | Tragic 81.8% |
| Ecuadorians | 0.0 /100 | #299 | Tragic 81.7% |
Demographics Similar to U.S. Virgin Islanders by GED/Equivalency
In terms of ged/equivalency, the demographic groups most similar to U.S. Virgin Islanders are Immigrants from Jamaica (82.9%, a difference of 0.040%), Barbadian (82.9%, a difference of 0.040%), Pennsylvania German (82.9%, a difference of 0.050%), Immigrants from Trinidad and Tobago (82.8%, a difference of 0.070%), and Hopi (83.0%, a difference of 0.090%).
| Demographics | Rating | Rank | GED/Equivalency |
| Bangladeshis | 0.2 /100 | #264 | Tragic 83.1% |
| West Indians | 0.2 /100 | #265 | Tragic 83.1% |
| Kiowa | 0.2 /100 | #266 | Tragic 83.1% |
| Trinidadians and Tobagonians | 0.2 /100 | #267 | Tragic 83.0% |
| Immigrants | Burma/Myanmar | 0.2 /100 | #268 | Tragic 83.0% |
| Hopi | 0.2 /100 | #269 | Tragic 83.0% |
| Immigrants | Jamaica | 0.2 /100 | #270 | Tragic 82.9% |
| U.S. Virgin Islanders | 0.2 /100 | #271 | Tragic 82.9% |
| Barbadians | 0.1 /100 | #272 | Tragic 82.9% |
| Pennsylvania Germans | 0.1 /100 | #273 | Tragic 82.9% |
| Immigrants | Trinidad and Tobago | 0.1 /100 | #274 | Tragic 82.8% |
| Seminole | 0.1 /100 | #275 | Tragic 82.8% |
| Blacks/African Americans | 0.1 /100 | #276 | Tragic 82.8% |
| Arapaho | 0.1 /100 | #277 | Tragic 82.8% |
| Immigrants | Laos | 0.1 /100 | #278 | Tragic 82.7% |