Immigrants from Oceania vs U.S. Virgin Islander GED/Equivalency
COMPARE
Immigrants from Oceania
U.S. Virgin Islander
GED/Equivalency
GED/Equivalency Comparison
Immigrants from Oceania
U.S. Virgin Islanders
85.5%
GED/EQUIVALENCY
33.6/ 100
METRIC RATING
184th/ 347
METRIC RANK
82.9%
GED/EQUIVALENCY
0.2/ 100
METRIC RATING
271st/ 347
METRIC RANK
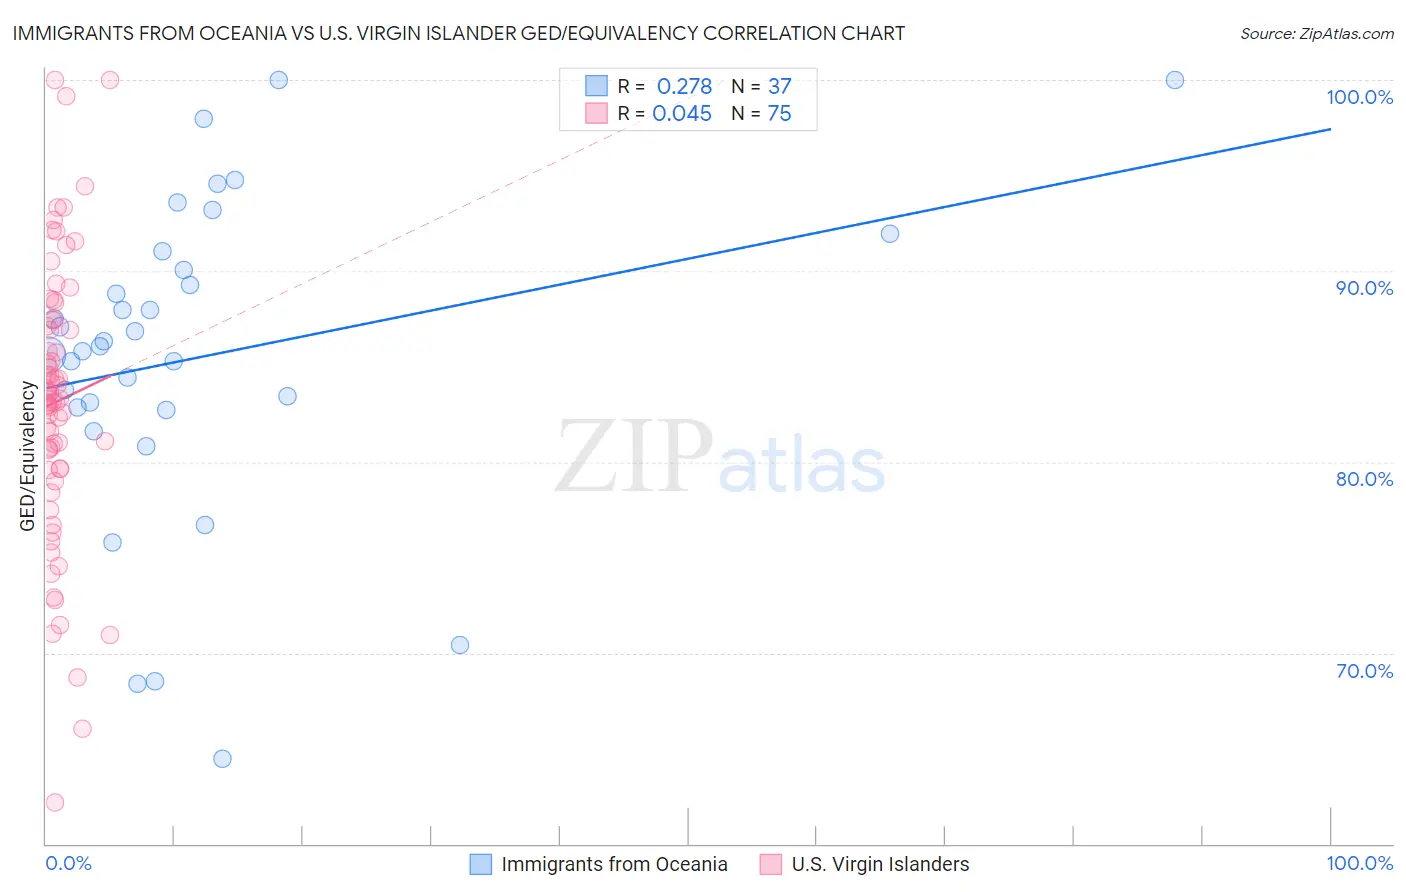
Immigrants from Oceania vs U.S. Virgin Islander GED/Equivalency Correlation Chart
The statistical analysis conducted on geographies consisting of 305,521,521 people shows a weak positive correlation between the proportion of Immigrants from Oceania and percentage of population with at least ged/equivalency education in the United States with a correlation coefficient (R) of 0.278 and weighted average of 85.5%. Similarly, the statistical analysis conducted on geographies consisting of 87,529,761 people shows no correlation between the proportion of U.S. Virgin Islanders and percentage of population with at least ged/equivalency education in the United States with a correlation coefficient (R) of 0.045 and weighted average of 82.9%, a difference of 3.1%.
GED/Equivalency Correlation Summary
| Measurement | Immigrants from Oceania | U.S. Virgin Islander |
| Minimum | 64.5% | 62.2% |
| Maximum | 100.0% | 100.0% |
| Range | 35.5% | 37.8% |
| Mean | 85.5% | 83.2% |
| Median | 86.1% | 83.3% |
| Interquartile 25% (IQ1) | 82.8% | 79.6% |
| Interquartile 75% (IQ3) | 90.5% | 87.4% |
| Interquartile Range (IQR) | 7.7% | 7.8% |
| Standard Deviation (Sample) | 8.3% | 7.3% |
| Standard Deviation (Population) | 8.2% | 7.3% |
Similar Demographics by GED/Equivalency
Demographics Similar to Immigrants from Oceania by GED/Equivalency
In terms of ged/equivalency, the demographic groups most similar to Immigrants from Oceania are Immigrants from Sudan (85.5%, a difference of 0.010%), Spanish (85.4%, a difference of 0.020%), Sudanese (85.5%, a difference of 0.040%), Spaniard (85.4%, a difference of 0.040%), and Moroccan (85.5%, a difference of 0.090%).
| Demographics | Rating | Rank | GED/Equivalency |
| Immigrants | Uganda | 45.2 /100 | #177 | Average 85.7% |
| Koreans | 41.2 /100 | #178 | Average 85.6% |
| Aleuts | 40.5 /100 | #179 | Average 85.6% |
| Immigrants | Southern Europe | 38.4 /100 | #180 | Fair 85.5% |
| Moroccans | 37.7 /100 | #181 | Fair 85.5% |
| Sudanese | 35.2 /100 | #182 | Fair 85.5% |
| Immigrants | Sudan | 34.2 /100 | #183 | Fair 85.5% |
| Immigrants | Oceania | 33.6 /100 | #184 | Fair 85.5% |
| Spanish | 32.8 /100 | #185 | Fair 85.4% |
| Spaniards | 31.9 /100 | #186 | Fair 85.4% |
| Immigrants | Afghanistan | 29.8 /100 | #187 | Fair 85.4% |
| Immigrants | Sierra Leone | 29.0 /100 | #188 | Fair 85.4% |
| Guamanians/Chamorros | 28.4 /100 | #189 | Fair 85.3% |
| Alaskan Athabascans | 27.5 /100 | #190 | Fair 85.3% |
| South American Indians | 22.8 /100 | #191 | Fair 85.2% |
Demographics Similar to U.S. Virgin Islanders by GED/Equivalency
In terms of ged/equivalency, the demographic groups most similar to U.S. Virgin Islanders are Immigrants from Jamaica (82.9%, a difference of 0.040%), Barbadian (82.9%, a difference of 0.040%), Pennsylvania German (82.9%, a difference of 0.050%), Immigrants from Trinidad and Tobago (82.8%, a difference of 0.070%), and Hopi (83.0%, a difference of 0.090%).
| Demographics | Rating | Rank | GED/Equivalency |
| Bangladeshis | 0.2 /100 | #264 | Tragic 83.1% |
| West Indians | 0.2 /100 | #265 | Tragic 83.1% |
| Kiowa | 0.2 /100 | #266 | Tragic 83.1% |
| Trinidadians and Tobagonians | 0.2 /100 | #267 | Tragic 83.0% |
| Immigrants | Burma/Myanmar | 0.2 /100 | #268 | Tragic 83.0% |
| Hopi | 0.2 /100 | #269 | Tragic 83.0% |
| Immigrants | Jamaica | 0.2 /100 | #270 | Tragic 82.9% |
| U.S. Virgin Islanders | 0.2 /100 | #271 | Tragic 82.9% |
| Barbadians | 0.1 /100 | #272 | Tragic 82.9% |
| Pennsylvania Germans | 0.1 /100 | #273 | Tragic 82.9% |
| Immigrants | Trinidad and Tobago | 0.1 /100 | #274 | Tragic 82.8% |
| Seminole | 0.1 /100 | #275 | Tragic 82.8% |
| Blacks/African Americans | 0.1 /100 | #276 | Tragic 82.8% |
| Arapaho | 0.1 /100 | #277 | Tragic 82.8% |
| Immigrants | Laos | 0.1 /100 | #278 | Tragic 82.7% |