Immigrants from Asia vs Yup'ik GED/Equivalency
COMPARE
Immigrants from Asia
Yup'ik
GED/Equivalency
GED/Equivalency Comparison
Immigrants from Asia
Yup'ik
86.6%
GED/EQUIVALENCY
87.4/ 100
METRIC RATING
135th/ 347
METRIC RANK
80.0%
GED/EQUIVALENCY
0.0/ 100
METRIC RATING
321st/ 347
METRIC RANK
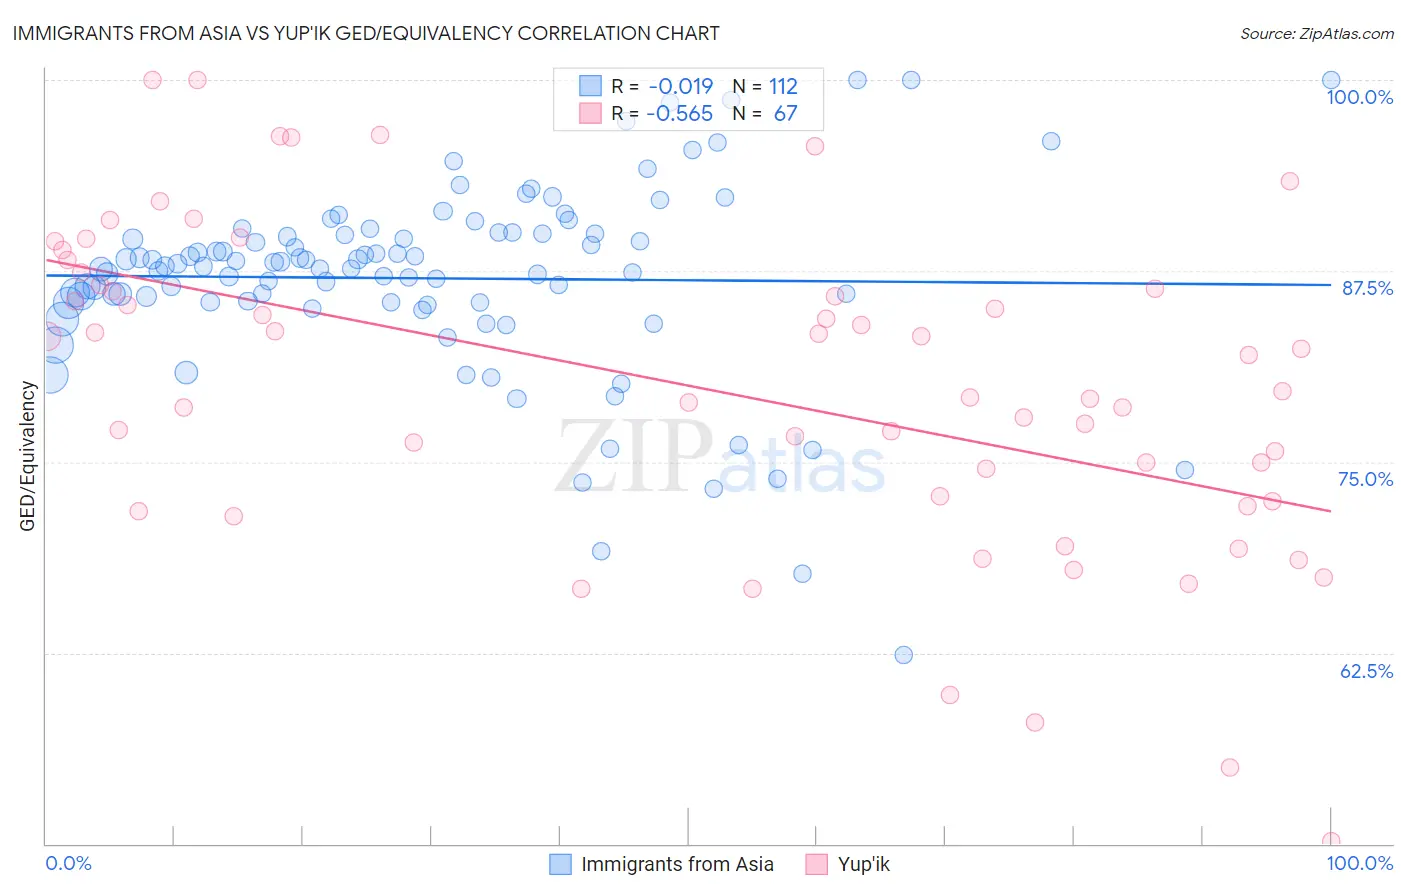
Immigrants from Asia vs Yup'ik GED/Equivalency Correlation Chart
The statistical analysis conducted on geographies consisting of 549,170,250 people shows no correlation between the proportion of Immigrants from Asia and percentage of population with at least ged/equivalency education in the United States with a correlation coefficient (R) of -0.019 and weighted average of 86.6%. Similarly, the statistical analysis conducted on geographies consisting of 39,962,947 people shows a substantial negative correlation between the proportion of Yup'ik and percentage of population with at least ged/equivalency education in the United States with a correlation coefficient (R) of -0.565 and weighted average of 80.0%, a difference of 8.2%.
GED/Equivalency Correlation Summary
| Measurement | Immigrants from Asia | Yup'ik |
| Minimum | 62.4% | 50.2% |
| Maximum | 100.0% | 100.0% |
| Range | 37.6% | 49.8% |
| Mean | 87.0% | 79.9% |
| Median | 87.8% | 79.6% |
| Interquartile 25% (IQ1) | 85.4% | 72.4% |
| Interquartile 75% (IQ3) | 90.0% | 86.6% |
| Interquartile Range (IQR) | 4.5% | 14.2% |
| Standard Deviation (Sample) | 6.3% | 10.6% |
| Standard Deviation (Population) | 6.3% | 10.5% |
Similar Demographics by GED/Equivalency
Demographics Similar to Immigrants from Asia by GED/Equivalency
In terms of ged/equivalency, the demographic groups most similar to Immigrants from Asia are Albanian (86.6%, a difference of 0.010%), Chilean (86.6%, a difference of 0.020%), Arab (86.6%, a difference of 0.030%), Tsimshian (86.6%, a difference of 0.040%), and Immigrants from Argentina (86.6%, a difference of 0.040%).
| Demographics | Rating | Rank | GED/Equivalency |
| Yugoslavians | 89.5 /100 | #128 | Excellent 86.7% |
| Immigrants | Ukraine | 88.9 /100 | #129 | Excellent 86.7% |
| Immigrants | Germany | 88.8 /100 | #130 | Excellent 86.7% |
| Immigrants | Spain | 88.5 /100 | #131 | Excellent 86.7% |
| Immigrants | Brazil | 88.4 /100 | #132 | Excellent 86.6% |
| Tsimshian | 88.3 /100 | #133 | Excellent 86.6% |
| Albanians | 87.7 /100 | #134 | Excellent 86.6% |
| Immigrants | Asia | 87.4 /100 | #135 | Excellent 86.6% |
| Chileans | 86.9 /100 | #136 | Excellent 86.6% |
| Arabs | 86.7 /100 | #137 | Excellent 86.6% |
| Immigrants | Argentina | 86.5 /100 | #138 | Excellent 86.6% |
| Immigrants | Malaysia | 85.0 /100 | #139 | Excellent 86.5% |
| Paraguayans | 84.1 /100 | #140 | Excellent 86.5% |
| Laotians | 83.2 /100 | #141 | Excellent 86.5% |
| Immigrants | Indonesia | 82.4 /100 | #142 | Excellent 86.4% |
Demographics Similar to Yup'ik by GED/Equivalency
In terms of ged/equivalency, the demographic groups most similar to Yup'ik are Lumbee (80.0%, a difference of 0.070%), Immigrants from Cuba (80.2%, a difference of 0.17%), Immigrants from Nicaragua (79.9%, a difference of 0.19%), Yaqui (80.5%, a difference of 0.58%), and Immigrants from Belize (80.5%, a difference of 0.58%).
| Demographics | Rating | Rank | GED/Equivalency |
| Belizeans | 0.0 /100 | #314 | Tragic 80.9% |
| Apache | 0.0 /100 | #315 | Tragic 80.7% |
| Central American Indians | 0.0 /100 | #316 | Tragic 80.6% |
| Immigrants | Caribbean | 0.0 /100 | #317 | Tragic 80.5% |
| Yaqui | 0.0 /100 | #318 | Tragic 80.5% |
| Immigrants | Belize | 0.0 /100 | #319 | Tragic 80.5% |
| Immigrants | Cuba | 0.0 /100 | #320 | Tragic 80.2% |
| Yup'ik | 0.0 /100 | #321 | Tragic 80.0% |
| Lumbee | 0.0 /100 | #322 | Tragic 80.0% |
| Immigrants | Nicaragua | 0.0 /100 | #323 | Tragic 79.9% |
| Mexican American Indians | 0.0 /100 | #324 | Tragic 79.4% |
| Hondurans | 0.0 /100 | #325 | Tragic 79.3% |
| Yuman | 0.0 /100 | #326 | Tragic 79.2% |
| Central Americans | 0.0 /100 | #327 | Tragic 79.2% |
| Hispanics or Latinos | 0.0 /100 | #328 | Tragic 79.1% |