Bulgarian vs U.S. Virgin Islander GED/Equivalency
COMPARE
Bulgarian
U.S. Virgin Islander
GED/Equivalency
GED/Equivalency Comparison
Bulgarians
U.S. Virgin Islanders
89.0%
GED/EQUIVALENCY
99.9/ 100
METRIC RATING
11th/ 347
METRIC RANK
82.9%
GED/EQUIVALENCY
0.2/ 100
METRIC RATING
271st/ 347
METRIC RANK
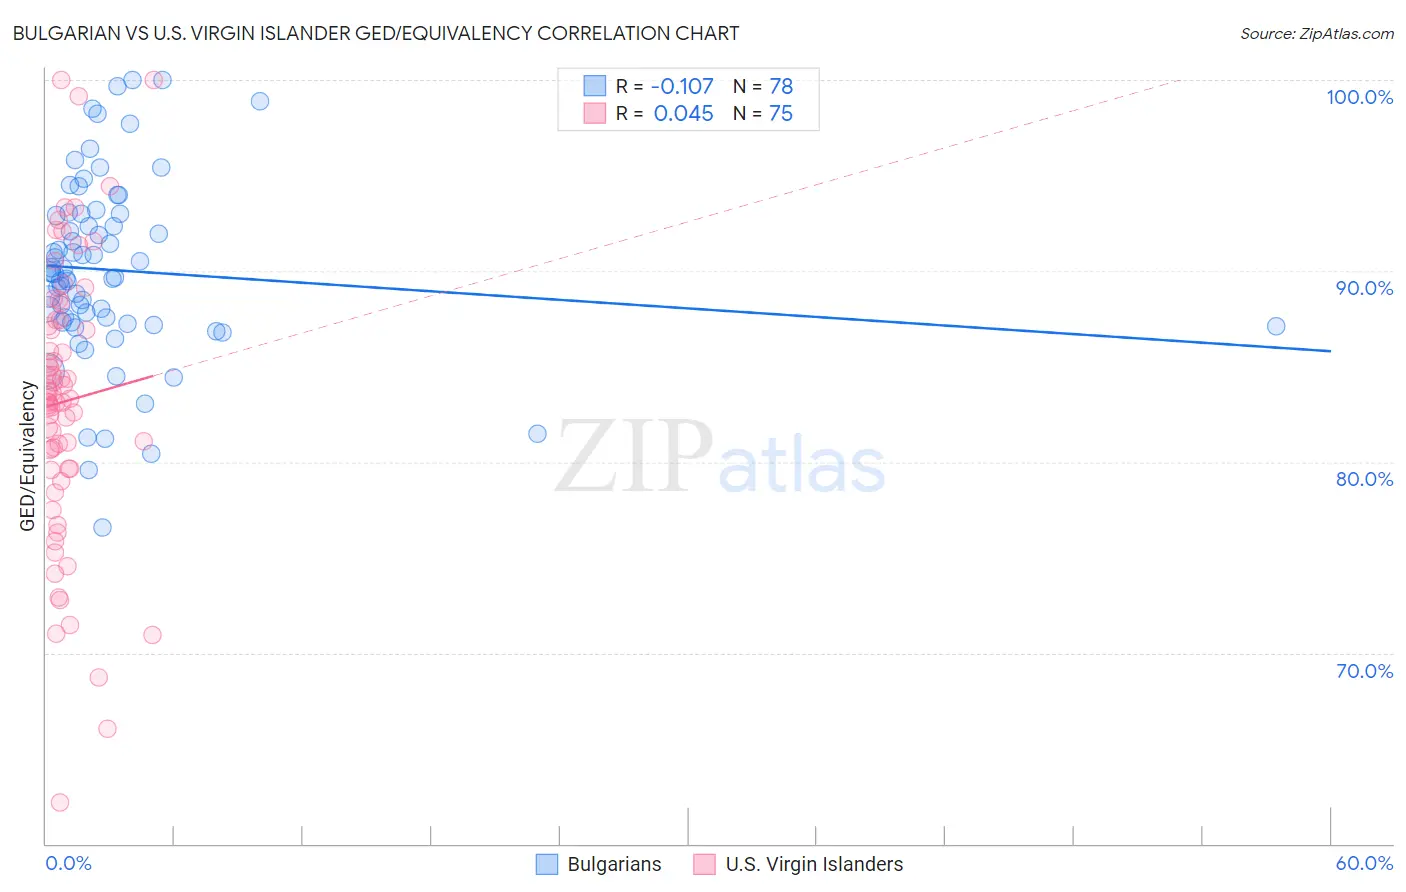
Bulgarian vs U.S. Virgin Islander GED/Equivalency Correlation Chart
The statistical analysis conducted on geographies consisting of 205,633,746 people shows a poor negative correlation between the proportion of Bulgarians and percentage of population with at least ged/equivalency education in the United States with a correlation coefficient (R) of -0.107 and weighted average of 89.0%. Similarly, the statistical analysis conducted on geographies consisting of 87,529,761 people shows no correlation between the proportion of U.S. Virgin Islanders and percentage of population with at least ged/equivalency education in the United States with a correlation coefficient (R) of 0.045 and weighted average of 82.9%, a difference of 7.3%.
GED/Equivalency Correlation Summary
| Measurement | Bulgarian | U.S. Virgin Islander |
| Minimum | 76.5% | 62.2% |
| Maximum | 100.0% | 100.0% |
| Range | 23.5% | 37.8% |
| Mean | 90.0% | 83.2% |
| Median | 89.9% | 83.3% |
| Interquartile 25% (IQ1) | 87.3% | 79.6% |
| Interquartile 75% (IQ3) | 93.0% | 87.4% |
| Interquartile Range (IQR) | 5.6% | 7.8% |
| Standard Deviation (Sample) | 4.8% | 7.3% |
| Standard Deviation (Population) | 4.8% | 7.3% |
Similar Demographics by GED/Equivalency
Demographics Similar to Bulgarians by GED/Equivalency
In terms of ged/equivalency, the demographic groups most similar to Bulgarians are Norwegian (89.0%, a difference of 0.040%), Lithuanian (88.9%, a difference of 0.040%), Immigrants from Iran (88.9%, a difference of 0.050%), Chinese (89.0%, a difference of 0.080%), and Cypriot (88.9%, a difference of 0.080%).
| Demographics | Rating | Rank | GED/Equivalency |
| Iranians | 100.0 /100 | #4 | Exceptional 89.2% |
| Latvians | 100.0 /100 | #5 | Exceptional 89.2% |
| Thais | 100.0 /100 | #6 | Exceptional 89.1% |
| Eastern Europeans | 99.9 /100 | #7 | Exceptional 89.1% |
| Carpatho Rusyns | 99.9 /100 | #8 | Exceptional 89.1% |
| Chinese | 99.9 /100 | #9 | Exceptional 89.0% |
| Norwegians | 99.9 /100 | #10 | Exceptional 89.0% |
| Bulgarians | 99.9 /100 | #11 | Exceptional 89.0% |
| Lithuanians | 99.9 /100 | #12 | Exceptional 88.9% |
| Immigrants | Iran | 99.9 /100 | #13 | Exceptional 88.9% |
| Cypriots | 99.9 /100 | #14 | Exceptional 88.9% |
| Okinawans | 99.9 /100 | #15 | Exceptional 88.9% |
| Immigrants | Taiwan | 99.9 /100 | #16 | Exceptional 88.8% |
| Croatians | 99.9 /100 | #17 | Exceptional 88.8% |
| Slovenes | 99.9 /100 | #18 | Exceptional 88.8% |
Demographics Similar to U.S. Virgin Islanders by GED/Equivalency
In terms of ged/equivalency, the demographic groups most similar to U.S. Virgin Islanders are Immigrants from Jamaica (82.9%, a difference of 0.040%), Barbadian (82.9%, a difference of 0.040%), Pennsylvania German (82.9%, a difference of 0.050%), Immigrants from Trinidad and Tobago (82.8%, a difference of 0.070%), and Hopi (83.0%, a difference of 0.090%).
| Demographics | Rating | Rank | GED/Equivalency |
| Bangladeshis | 0.2 /100 | #264 | Tragic 83.1% |
| West Indians | 0.2 /100 | #265 | Tragic 83.1% |
| Kiowa | 0.2 /100 | #266 | Tragic 83.1% |
| Trinidadians and Tobagonians | 0.2 /100 | #267 | Tragic 83.0% |
| Immigrants | Burma/Myanmar | 0.2 /100 | #268 | Tragic 83.0% |
| Hopi | 0.2 /100 | #269 | Tragic 83.0% |
| Immigrants | Jamaica | 0.2 /100 | #270 | Tragic 82.9% |
| U.S. Virgin Islanders | 0.2 /100 | #271 | Tragic 82.9% |
| Barbadians | 0.1 /100 | #272 | Tragic 82.9% |
| Pennsylvania Germans | 0.1 /100 | #273 | Tragic 82.9% |
| Immigrants | Trinidad and Tobago | 0.1 /100 | #274 | Tragic 82.8% |
| Seminole | 0.1 /100 | #275 | Tragic 82.8% |
| Blacks/African Americans | 0.1 /100 | #276 | Tragic 82.8% |
| Arapaho | 0.1 /100 | #277 | Tragic 82.8% |
| Immigrants | Laos | 0.1 /100 | #278 | Tragic 82.7% |