Immigrants from Asia vs Choctaw GED/Equivalency
COMPARE
Immigrants from Asia
Choctaw
GED/Equivalency
GED/Equivalency Comparison
Immigrants from Asia
Choctaw
86.6%
GED/EQUIVALENCY
87.4/ 100
METRIC RATING
135th/ 347
METRIC RANK
83.1%
GED/EQUIVALENCY
0.3/ 100
METRIC RATING
260th/ 347
METRIC RANK
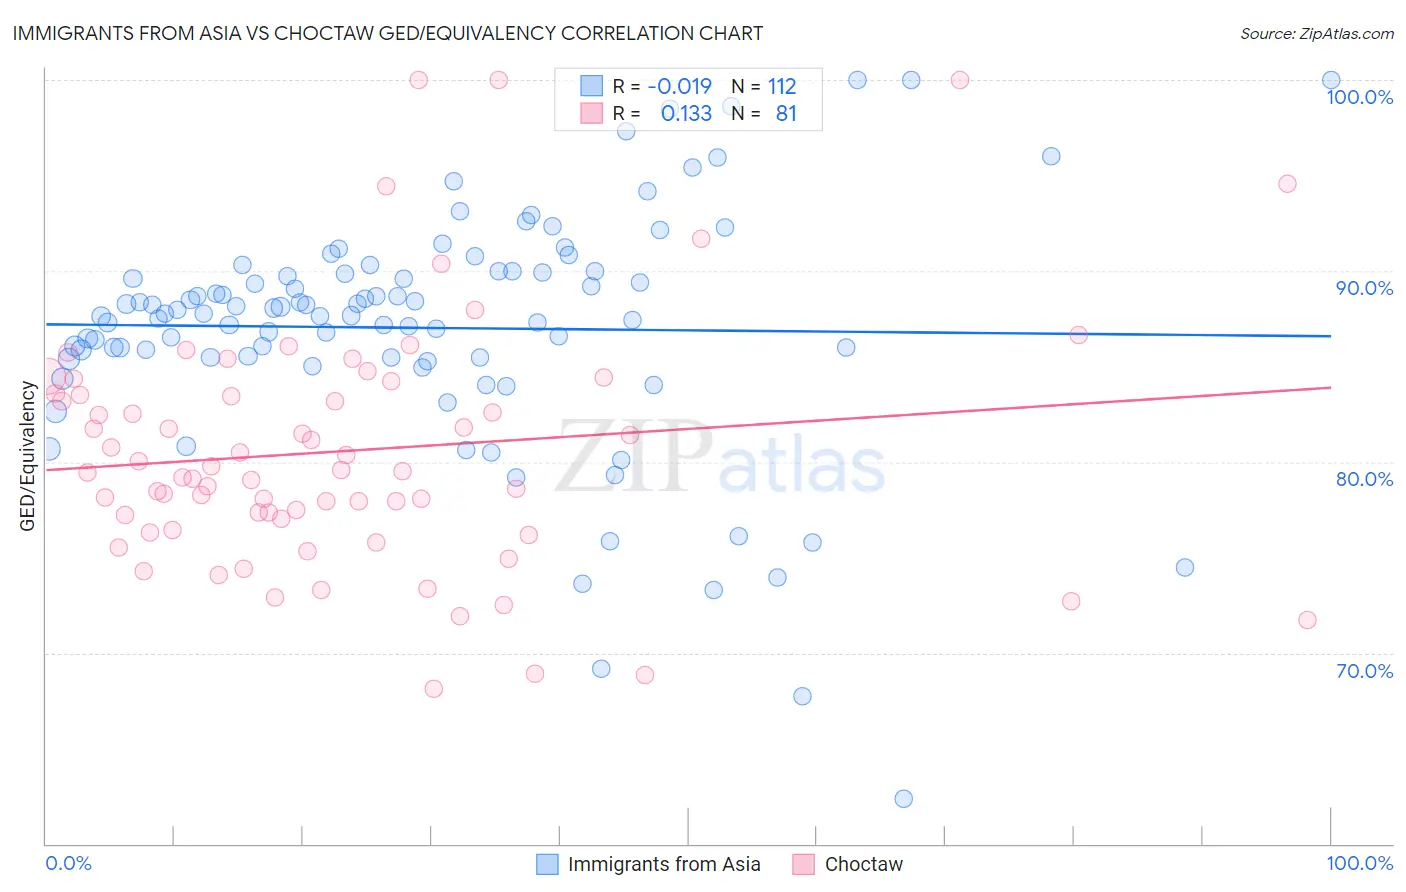
Immigrants from Asia vs Choctaw GED/Equivalency Correlation Chart
The statistical analysis conducted on geographies consisting of 549,170,250 people shows no correlation between the proportion of Immigrants from Asia and percentage of population with at least ged/equivalency education in the United States with a correlation coefficient (R) of -0.019 and weighted average of 86.6%. Similarly, the statistical analysis conducted on geographies consisting of 269,738,650 people shows a poor positive correlation between the proportion of Choctaw and percentage of population with at least ged/equivalency education in the United States with a correlation coefficient (R) of 0.133 and weighted average of 83.1%, a difference of 4.2%.
GED/Equivalency Correlation Summary
| Measurement | Immigrants from Asia | Choctaw |
| Minimum | 62.4% | 68.1% |
| Maximum | 100.0% | 100.0% |
| Range | 37.6% | 31.9% |
| Mean | 87.0% | 80.6% |
| Median | 87.8% | 79.5% |
| Interquartile 25% (IQ1) | 85.4% | 76.7% |
| Interquartile 75% (IQ3) | 90.0% | 83.9% |
| Interquartile Range (IQR) | 4.5% | 7.2% |
| Standard Deviation (Sample) | 6.3% | 6.5% |
| Standard Deviation (Population) | 6.3% | 6.5% |
Similar Demographics by GED/Equivalency
Demographics Similar to Immigrants from Asia by GED/Equivalency
In terms of ged/equivalency, the demographic groups most similar to Immigrants from Asia are Albanian (86.6%, a difference of 0.010%), Chilean (86.6%, a difference of 0.020%), Arab (86.6%, a difference of 0.030%), Tsimshian (86.6%, a difference of 0.040%), and Immigrants from Argentina (86.6%, a difference of 0.040%).
| Demographics | Rating | Rank | GED/Equivalency |
| Yugoslavians | 89.5 /100 | #128 | Excellent 86.7% |
| Immigrants | Ukraine | 88.9 /100 | #129 | Excellent 86.7% |
| Immigrants | Germany | 88.8 /100 | #130 | Excellent 86.7% |
| Immigrants | Spain | 88.5 /100 | #131 | Excellent 86.7% |
| Immigrants | Brazil | 88.4 /100 | #132 | Excellent 86.6% |
| Tsimshian | 88.3 /100 | #133 | Excellent 86.6% |
| Albanians | 87.7 /100 | #134 | Excellent 86.6% |
| Immigrants | Asia | 87.4 /100 | #135 | Excellent 86.6% |
| Chileans | 86.9 /100 | #136 | Excellent 86.6% |
| Arabs | 86.7 /100 | #137 | Excellent 86.6% |
| Immigrants | Argentina | 86.5 /100 | #138 | Excellent 86.6% |
| Immigrants | Malaysia | 85.0 /100 | #139 | Excellent 86.5% |
| Paraguayans | 84.1 /100 | #140 | Excellent 86.5% |
| Laotians | 83.2 /100 | #141 | Excellent 86.5% |
| Immigrants | Indonesia | 82.4 /100 | #142 | Excellent 86.4% |
Demographics Similar to Choctaw by GED/Equivalency
In terms of ged/equivalency, the demographic groups most similar to Choctaw are Immigrants from Vietnam (83.2%, a difference of 0.030%), Inupiat (83.1%, a difference of 0.050%), Immigrants from Armenia (83.1%, a difference of 0.060%), Immigrants from Congo (83.1%, a difference of 0.070%), and Bangladeshi (83.1%, a difference of 0.080%).
| Demographics | Rating | Rank | GED/Equivalency |
| Comanche | 0.7 /100 | #253 | Tragic 83.6% |
| Creek | 0.7 /100 | #254 | Tragic 83.6% |
| Colville | 0.5 /100 | #255 | Tragic 83.4% |
| Africans | 0.5 /100 | #256 | Tragic 83.4% |
| Jamaicans | 0.4 /100 | #257 | Tragic 83.3% |
| Malaysians | 0.4 /100 | #258 | Tragic 83.3% |
| Immigrants | Vietnam | 0.3 /100 | #259 | Tragic 83.2% |
| Choctaw | 0.3 /100 | #260 | Tragic 83.1% |
| Inupiat | 0.2 /100 | #261 | Tragic 83.1% |
| Immigrants | Armenia | 0.2 /100 | #262 | Tragic 83.1% |
| Immigrants | Congo | 0.2 /100 | #263 | Tragic 83.1% |
| Bangladeshis | 0.2 /100 | #264 | Tragic 83.1% |
| West Indians | 0.2 /100 | #265 | Tragic 83.1% |
| Kiowa | 0.2 /100 | #266 | Tragic 83.1% |
| Trinidadians and Tobagonians | 0.2 /100 | #267 | Tragic 83.0% |