Immigrants from Asia vs Immigrants from Iraq Median Male Earnings
COMPARE
Immigrants from Asia
Immigrants from Iraq
Median Male Earnings
Median Male Earnings Comparison
Immigrants from Asia
Immigrants from Iraq
$63,240
MEDIAN MALE EARNINGS
100.0/ 100
METRIC RATING
35th/ 347
METRIC RANK
$52,681
MEDIAN MALE EARNINGS
14.5/ 100
METRIC RATING
206th/ 347
METRIC RANK
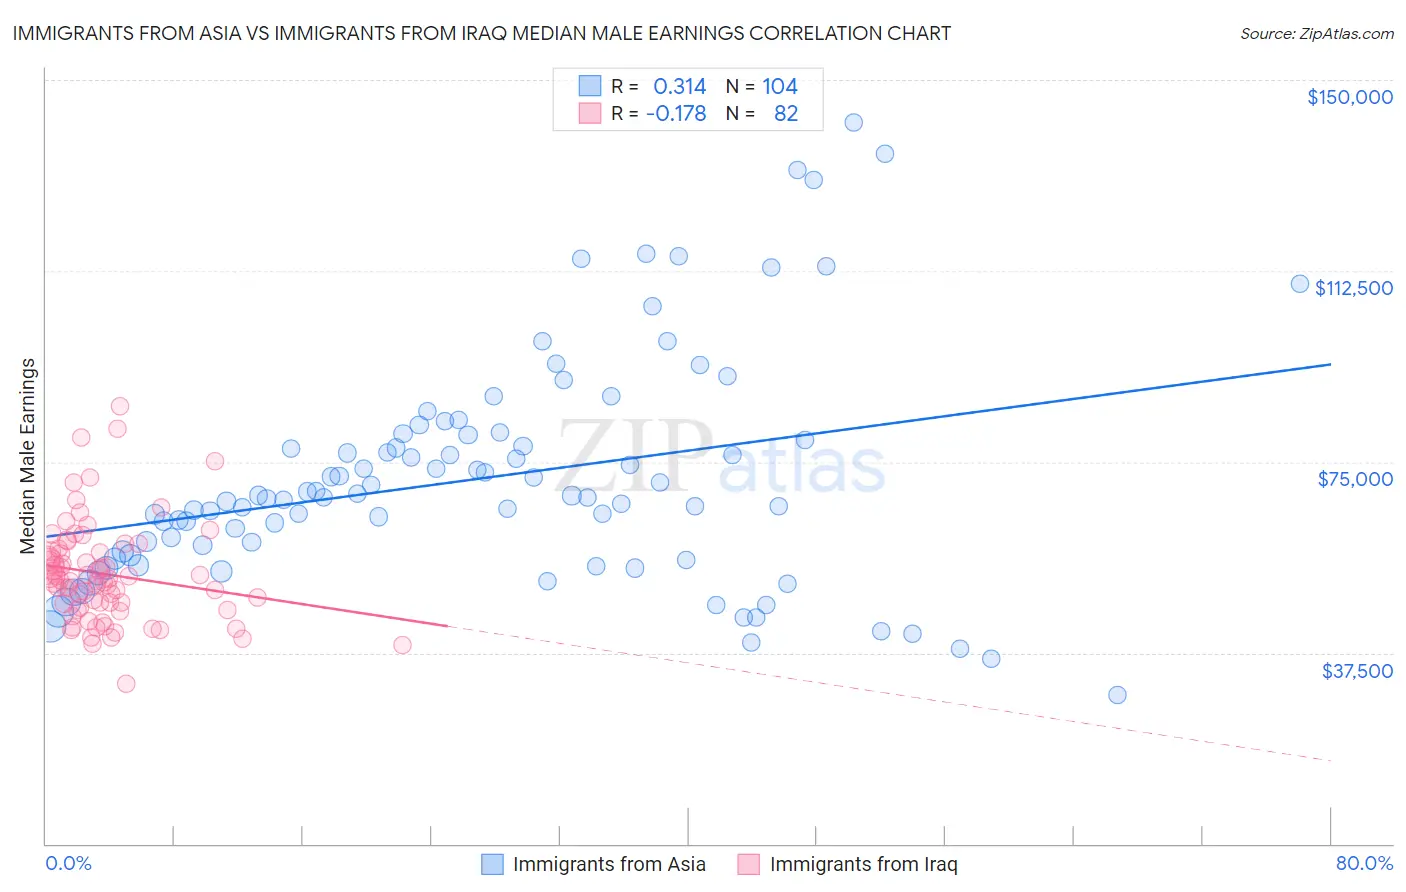
Immigrants from Asia vs Immigrants from Iraq Median Male Earnings Correlation Chart
The statistical analysis conducted on geographies consisting of 548,524,419 people shows a mild positive correlation between the proportion of Immigrants from Asia and median male earnings in the United States with a correlation coefficient (R) of 0.314 and weighted average of $63,240. Similarly, the statistical analysis conducted on geographies consisting of 194,755,120 people shows a poor negative correlation between the proportion of Immigrants from Iraq and median male earnings in the United States with a correlation coefficient (R) of -0.178 and weighted average of $52,681, a difference of 20.0%.
Median Male Earnings Correlation Summary
| Measurement | Immigrants from Asia | Immigrants from Iraq |
| Minimum | $29,236 | $31,325 |
| Maximum | $141,758 | $85,833 |
| Range | $112,522 | $54,508 |
| Mean | $71,617 | $52,958 |
| Median | $67,918 | $51,715 |
| Interquartile 25% (IQ1) | $56,355 | $46,434 |
| Interquartile 75% (IQ3) | $79,747 | $57,443 |
| Interquartile Range (IQR) | $23,393 | $11,008 |
| Standard Deviation (Sample) | $22,311 | $9,945 |
| Standard Deviation (Population) | $22,203 | $9,884 |
Similar Demographics by Median Male Earnings
Demographics Similar to Immigrants from Asia by Median Male Earnings
In terms of median male earnings, the demographic groups most similar to Immigrants from Asia are Israeli ($63,228, a difference of 0.020%), Immigrants from Russia ($63,326, a difference of 0.14%), Immigrants from Lithuania ($63,346, a difference of 0.17%), Soviet Union ($63,382, a difference of 0.22%), and Immigrants from Sri Lanka ($63,099, a difference of 0.22%).
| Demographics | Rating | Rank | Median Male Earnings |
| Russians | 100.0 /100 | #28 | Exceptional $63,939 |
| Asians | 100.0 /100 | #29 | Exceptional $63,827 |
| Immigrants | France | 100.0 /100 | #30 | Exceptional $63,715 |
| Latvians | 100.0 /100 | #31 | Exceptional $63,498 |
| Soviet Union | 100.0 /100 | #32 | Exceptional $63,382 |
| Immigrants | Lithuania | 100.0 /100 | #33 | Exceptional $63,346 |
| Immigrants | Russia | 100.0 /100 | #34 | Exceptional $63,326 |
| Immigrants | Asia | 100.0 /100 | #35 | Exceptional $63,240 |
| Israelis | 100.0 /100 | #36 | Exceptional $63,228 |
| Immigrants | Sri Lanka | 100.0 /100 | #37 | Exceptional $63,099 |
| Maltese | 100.0 /100 | #38 | Exceptional $62,953 |
| Immigrants | South Africa | 100.0 /100 | #39 | Exceptional $62,899 |
| Australians | 100.0 /100 | #40 | Exceptional $62,857 |
| Immigrants | Turkey | 100.0 /100 | #41 | Exceptional $62,728 |
| Immigrants | Greece | 100.0 /100 | #42 | Exceptional $62,689 |
Demographics Similar to Immigrants from Iraq by Median Male Earnings
In terms of median male earnings, the demographic groups most similar to Immigrants from Iraq are Immigrants from Colombia ($52,725, a difference of 0.080%), Ghanaian ($52,810, a difference of 0.24%), Panamanian ($52,835, a difference of 0.29%), Vietnamese ($52,525, a difference of 0.30%), and Venezuelan ($52,510, a difference of 0.33%).
| Demographics | Rating | Rank | Median Male Earnings |
| Tongans | 22.3 /100 | #199 | Fair $53,218 |
| Immigrants | Thailand | 17.5 /100 | #200 | Poor $52,908 |
| Immigrants | Bosnia and Herzegovina | 16.9 /100 | #201 | Poor $52,869 |
| Immigrants | Uruguay | 16.8 /100 | #202 | Poor $52,860 |
| Panamanians | 16.5 /100 | #203 | Poor $52,835 |
| Ghanaians | 16.1 /100 | #204 | Poor $52,810 |
| Immigrants | Colombia | 15.0 /100 | #205 | Poor $52,725 |
| Immigrants | Iraq | 14.5 /100 | #206 | Poor $52,681 |
| Vietnamese | 12.7 /100 | #207 | Poor $52,525 |
| Venezuelans | 12.5 /100 | #208 | Poor $52,510 |
| Bermudans | 12.1 /100 | #209 | Poor $52,465 |
| Delaware | 11.5 /100 | #210 | Poor $52,412 |
| Tlingit-Haida | 11.5 /100 | #211 | Poor $52,409 |
| Cajuns | 10.7 /100 | #212 | Poor $52,325 |
| Native Hawaiians | 10.5 /100 | #213 | Poor $52,306 |