Liberian vs Immigrants from Iraq GED/Equivalency
COMPARE
Liberian
Immigrants from Iraq
GED/Equivalency
GED/Equivalency Comparison
Liberians
Immigrants from Iraq
85.0%
GED/EQUIVALENCY
14.6/ 100
METRIC RATING
205th/ 347
METRIC RANK
86.1%
GED/EQUIVALENCY
68.1/ 100
METRIC RATING
162nd/ 347
METRIC RANK
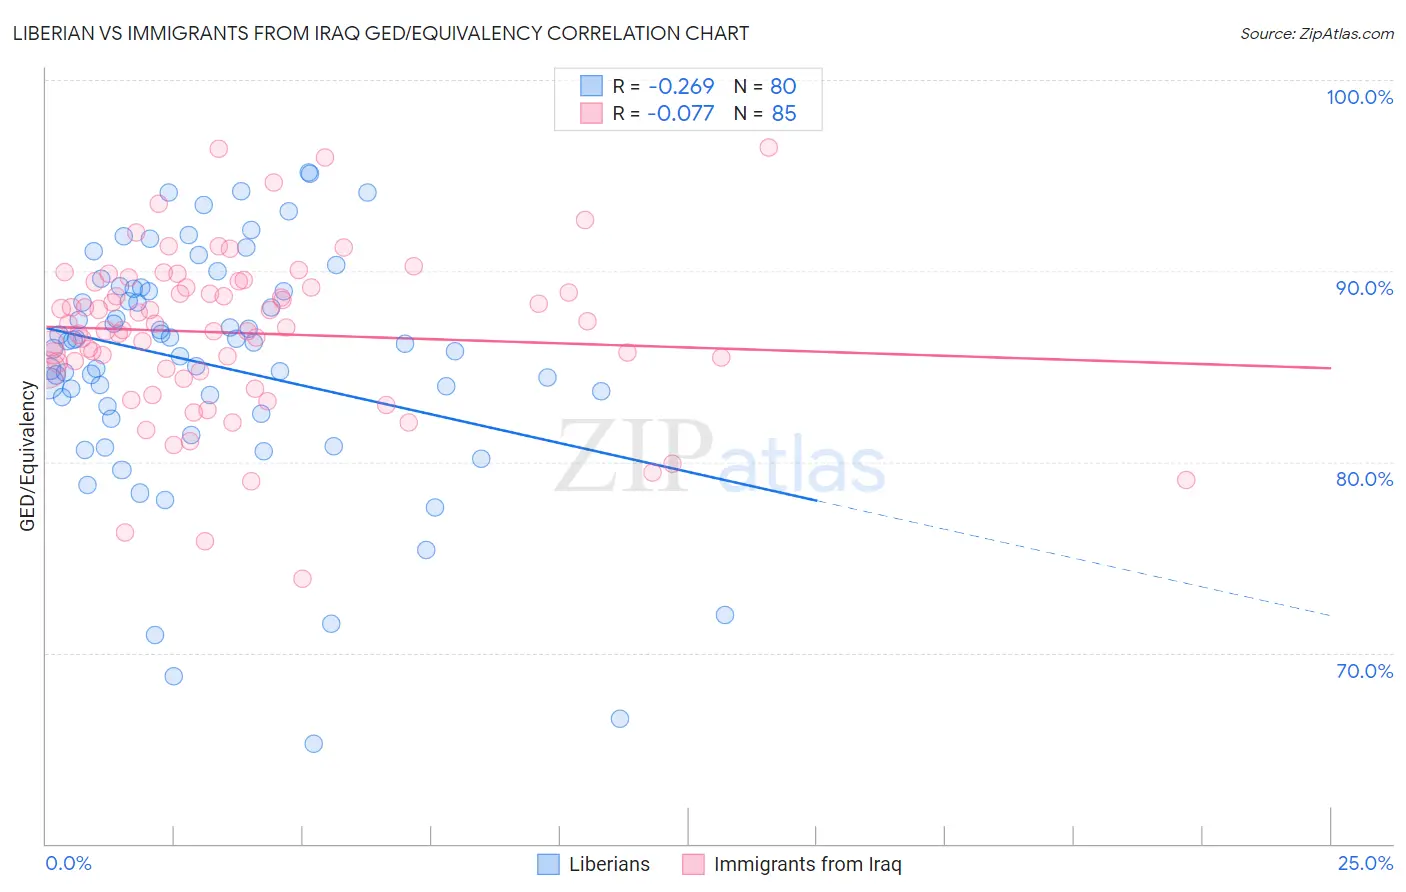
Liberian vs Immigrants from Iraq GED/Equivalency Correlation Chart
The statistical analysis conducted on geographies consisting of 118,103,458 people shows a weak negative correlation between the proportion of Liberians and percentage of population with at least ged/equivalency education in the United States with a correlation coefficient (R) of -0.269 and weighted average of 85.0%. Similarly, the statistical analysis conducted on geographies consisting of 194,780,026 people shows a slight negative correlation between the proportion of Immigrants from Iraq and percentage of population with at least ged/equivalency education in the United States with a correlation coefficient (R) of -0.077 and weighted average of 86.1%, a difference of 1.3%.
GED/Equivalency Correlation Summary
| Measurement | Liberian | Immigrants from Iraq |
| Minimum | 65.2% | 73.9% |
| Maximum | 95.2% | 96.5% |
| Range | 29.9% | 22.6% |
| Mean | 85.1% | 86.7% |
| Median | 86.2% | 87.0% |
| Interquartile 25% (IQ1) | 82.7% | 84.8% |
| Interquartile 75% (IQ3) | 89.0% | 89.3% |
| Interquartile Range (IQR) | 6.3% | 4.5% |
| Standard Deviation (Sample) | 6.3% | 4.3% |
| Standard Deviation (Population) | 6.3% | 4.3% |
Similar Demographics by GED/Equivalency
Demographics Similar to Liberians by GED/Equivalency
In terms of ged/equivalency, the demographic groups most similar to Liberians are Panamanian (85.0%, a difference of 0.030%), Hawaiian (85.0%, a difference of 0.030%), Samoan (84.9%, a difference of 0.040%), Portuguese (85.0%, a difference of 0.050%), and Cree (85.0%, a difference of 0.050%).
| Demographics | Rating | Rank | GED/Equivalency |
| Immigrants | Africa | 17.5 /100 | #198 | Poor 85.1% |
| Somalis | 16.4 /100 | #199 | Poor 85.0% |
| Uruguayans | 16.0 /100 | #200 | Poor 85.0% |
| Portuguese | 15.9 /100 | #201 | Poor 85.0% |
| Cree | 15.9 /100 | #202 | Poor 85.0% |
| Panamanians | 15.3 /100 | #203 | Poor 85.0% |
| Hawaiians | 15.2 /100 | #204 | Poor 85.0% |
| Liberians | 14.6 /100 | #205 | Poor 85.0% |
| Samoans | 13.7 /100 | #206 | Poor 84.9% |
| Hmong | 13.1 /100 | #207 | Poor 84.9% |
| Marshallese | 12.5 /100 | #208 | Poor 84.9% |
| Colombians | 12.3 /100 | #209 | Poor 84.9% |
| Immigrants | Cameroon | 12.1 /100 | #210 | Poor 84.9% |
| South Americans | 10.9 /100 | #211 | Poor 84.8% |
| Immigrants | Somalia | 10.6 /100 | #212 | Poor 84.8% |
Demographics Similar to Immigrants from Iraq by GED/Equivalency
In terms of ged/equivalency, the demographic groups most similar to Immigrants from Iraq are Immigrants from Morocco (86.1%, a difference of 0.030%), Immigrants from Syria (86.1%, a difference of 0.030%), Ugandan (86.1%, a difference of 0.040%), Venezuelan (86.0%, a difference of 0.060%), and Immigrants from Kenya (86.2%, a difference of 0.090%).
| Demographics | Rating | Rank | GED/Equivalency |
| Iraqis | 75.2 /100 | #155 | Good 86.2% |
| Immigrants | Nepal | 73.3 /100 | #156 | Good 86.2% |
| Whites/Caucasians | 72.2 /100 | #157 | Good 86.2% |
| German Russians | 72.1 /100 | #158 | Good 86.2% |
| Immigrants | Kenya | 71.8 /100 | #159 | Good 86.2% |
| Immigrants | Morocco | 69.5 /100 | #160 | Good 86.1% |
| Immigrants | Syria | 69.3 /100 | #161 | Good 86.1% |
| Immigrants | Iraq | 68.1 /100 | #162 | Good 86.1% |
| Ugandans | 66.3 /100 | #163 | Good 86.1% |
| Venezuelans | 65.5 /100 | #164 | Good 86.0% |
| Alsatians | 64.3 /100 | #165 | Good 86.0% |
| Immigrants | Albania | 64.2 /100 | #166 | Good 86.0% |
| Ethiopians | 63.7 /100 | #167 | Good 86.0% |
| Sierra Leoneans | 61.8 /100 | #168 | Good 86.0% |
| Immigrants | Ethiopia | 61.2 /100 | #169 | Good 86.0% |