Immigrants from Yemen vs Eastern European Female Disability
COMPARE
Immigrants from Yemen
Eastern European
Female Disability
Female Disability Comparison
Immigrants from Yemen
Eastern Europeans
13.2%
FEMALE DISABILITY
0.0/ 100
METRIC RATING
290th/ 347
METRIC RANK
11.5%
FEMALE DISABILITY
99.7/ 100
METRIC RATING
81st/ 347
METRIC RANK
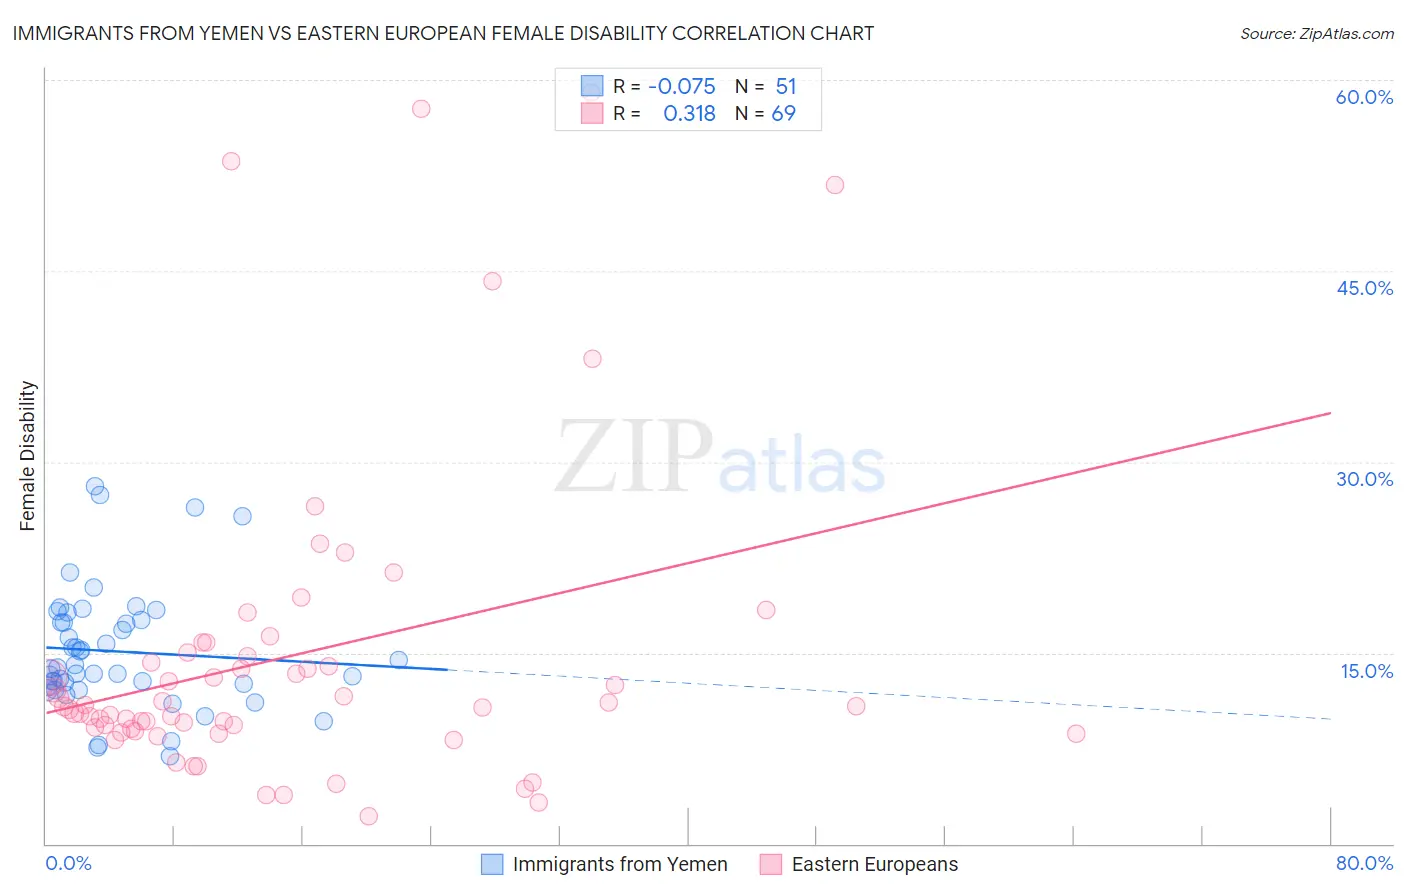
Immigrants from Yemen vs Eastern European Female Disability Correlation Chart
The statistical analysis conducted on geographies consisting of 82,433,611 people shows a slight negative correlation between the proportion of Immigrants from Yemen and percentage of females with a disability in the United States with a correlation coefficient (R) of -0.075 and weighted average of 13.2%. Similarly, the statistical analysis conducted on geographies consisting of 461,176,022 people shows a mild positive correlation between the proportion of Eastern Europeans and percentage of females with a disability in the United States with a correlation coefficient (R) of 0.318 and weighted average of 11.5%, a difference of 14.5%.
Female Disability Correlation Summary
| Measurement | Immigrants from Yemen | Eastern European |
| Minimum | 6.9% | 2.2% |
| Maximum | 28.1% | 59.0% |
| Range | 21.2% | 56.8% |
| Mean | 15.1% | 14.7% |
| Median | 13.9% | 10.8% |
| Interquartile 25% (IQ1) | 12.4% | 8.9% |
| Interquartile 75% (IQ3) | 17.6% | 14.8% |
| Interquartile Range (IQR) | 5.2% | 5.9% |
| Standard Deviation (Sample) | 4.8% | 12.3% |
| Standard Deviation (Population) | 4.7% | 12.2% |
Similar Demographics by Female Disability
Demographics Similar to Immigrants from Yemen by Female Disability
In terms of female disability, the demographic groups most similar to Immigrants from Yemen are Tlingit-Haida (13.2%, a difference of 0.0%), Shoshone (13.2%, a difference of 0.060%), White/Caucasian (13.2%, a difference of 0.18%), Yakama (13.2%, a difference of 0.23%), and Yaqui (13.2%, a difference of 0.27%).
| Demographics | Rating | Rank | Female Disability |
| English | 0.0 /100 | #283 | Tragic 13.1% |
| Hmong | 0.0 /100 | #284 | Tragic 13.1% |
| Bangladeshis | 0.0 /100 | #285 | Tragic 13.1% |
| Fijians | 0.0 /100 | #286 | Tragic 13.1% |
| Yaqui | 0.0 /100 | #287 | Tragic 13.2% |
| Whites/Caucasians | 0.0 /100 | #288 | Tragic 13.2% |
| Tlingit-Haida | 0.0 /100 | #289 | Tragic 13.2% |
| Immigrants | Yemen | 0.0 /100 | #290 | Tragic 13.2% |
| Shoshone | 0.0 /100 | #291 | Tragic 13.2% |
| Yakama | 0.0 /100 | #292 | Tragic 13.2% |
| Marshallese | 0.0 /100 | #293 | Tragic 13.3% |
| Celtics | 0.0 /100 | #294 | Tragic 13.3% |
| French | 0.0 /100 | #295 | Tragic 13.3% |
| Nepalese | 0.0 /100 | #296 | Tragic 13.3% |
| Slovaks | 0.0 /100 | #297 | Tragic 13.3% |
Demographics Similar to Eastern Europeans by Female Disability
In terms of female disability, the demographic groups most similar to Eastern Europeans are Immigrants from Jordan (11.5%, a difference of 0.14%), Sierra Leonean (11.5%, a difference of 0.15%), Immigrants from South Africa (11.5%, a difference of 0.17%), Immigrants from Eritrea (11.5%, a difference of 0.18%), and Immigrants from Afghanistan (11.5%, a difference of 0.18%).
| Demographics | Rating | Rank | Female Disability |
| Bhutanese | 99.8 /100 | #74 | Exceptional 11.5% |
| Immigrants | Lebanon | 99.7 /100 | #75 | Exceptional 11.5% |
| Immigrants | Eritrea | 99.7 /100 | #76 | Exceptional 11.5% |
| Immigrants | Afghanistan | 99.7 /100 | #77 | Exceptional 11.5% |
| Immigrants | South Africa | 99.7 /100 | #78 | Exceptional 11.5% |
| Sierra Leoneans | 99.7 /100 | #79 | Exceptional 11.5% |
| Immigrants | Jordan | 99.7 /100 | #80 | Exceptional 11.5% |
| Eastern Europeans | 99.7 /100 | #81 | Exceptional 11.5% |
| Luxembourgers | 99.6 /100 | #82 | Exceptional 11.6% |
| Immigrants | Serbia | 99.6 /100 | #83 | Exceptional 11.6% |
| Immigrants | Poland | 99.6 /100 | #84 | Exceptional 11.6% |
| Palestinians | 99.6 /100 | #85 | Exceptional 11.6% |
| Immigrants | Cameroon | 99.6 /100 | #86 | Exceptional 11.6% |
| Immigrants | Denmark | 99.5 /100 | #87 | Exceptional 11.6% |
| Yup'ik | 99.5 /100 | #88 | Exceptional 11.6% |