Immigrants from Yemen vs Argentinean Female Disability
COMPARE
Immigrants from Yemen
Argentinean
Female Disability
Female Disability Comparison
Immigrants from Yemen
Argentineans
13.2%
FEMALE DISABILITY
0.0/ 100
METRIC RATING
290th/ 347
METRIC RANK
11.0%
FEMALE DISABILITY
100.0/ 100
METRIC RATING
26th/ 347
METRIC RANK
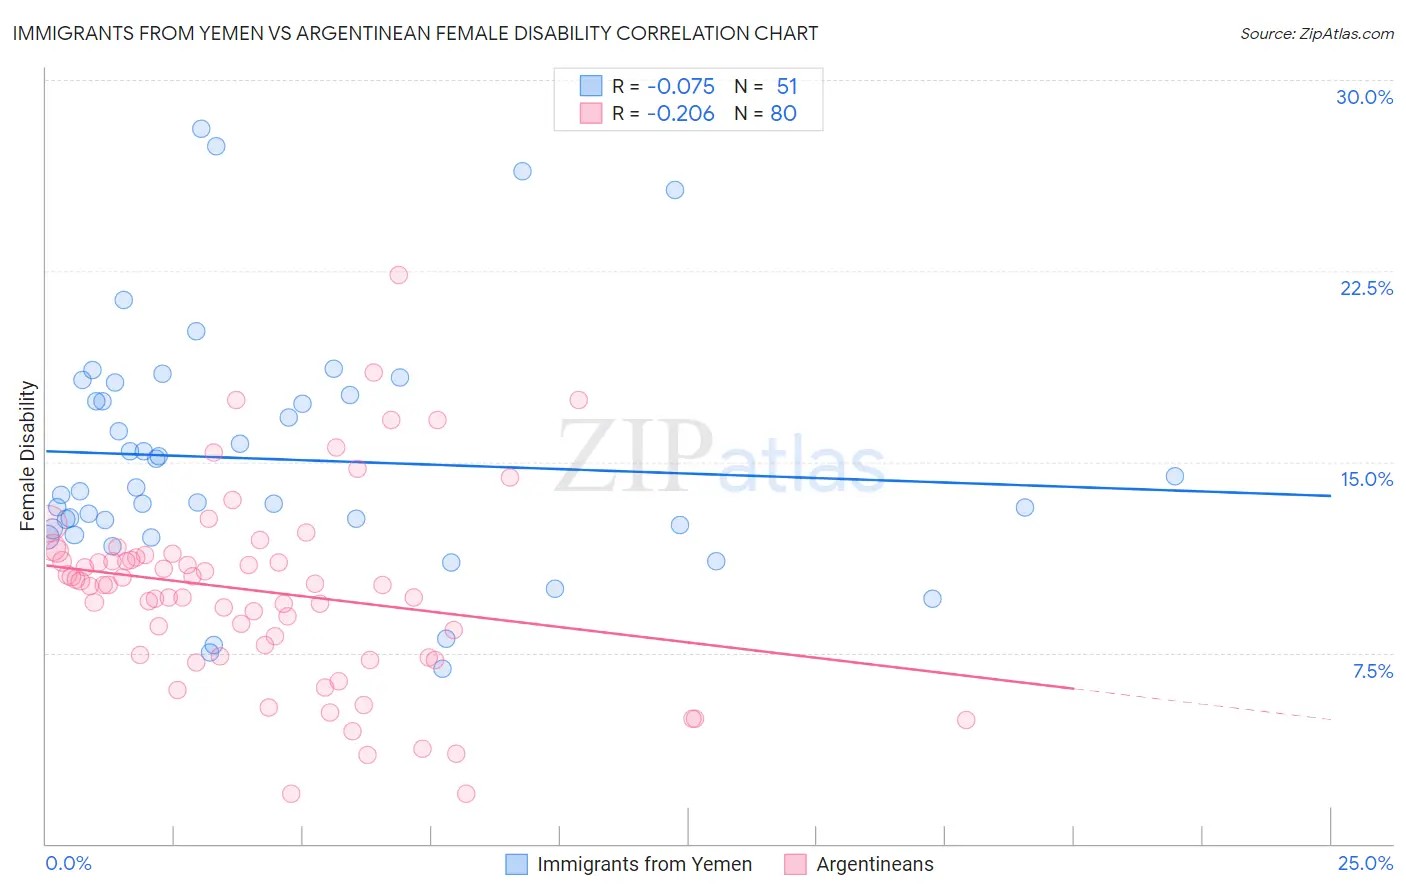
Immigrants from Yemen vs Argentinean Female Disability Correlation Chart
The statistical analysis conducted on geographies consisting of 82,433,611 people shows a slight negative correlation between the proportion of Immigrants from Yemen and percentage of females with a disability in the United States with a correlation coefficient (R) of -0.075 and weighted average of 13.2%. Similarly, the statistical analysis conducted on geographies consisting of 297,133,447 people shows a weak negative correlation between the proportion of Argentineans and percentage of females with a disability in the United States with a correlation coefficient (R) of -0.206 and weighted average of 11.0%, a difference of 19.9%.
Female Disability Correlation Summary
| Measurement | Immigrants from Yemen | Argentinean |
| Minimum | 6.9% | 1.9% |
| Maximum | 28.1% | 22.3% |
| Range | 21.2% | 20.4% |
| Mean | 15.1% | 9.9% |
| Median | 13.9% | 10.2% |
| Interquartile 25% (IQ1) | 12.4% | 7.4% |
| Interquartile 75% (IQ3) | 17.6% | 11.3% |
| Interquartile Range (IQR) | 5.2% | 3.9% |
| Standard Deviation (Sample) | 4.8% | 3.8% |
| Standard Deviation (Population) | 4.7% | 3.7% |
Similar Demographics by Female Disability
Demographics Similar to Immigrants from Yemen by Female Disability
In terms of female disability, the demographic groups most similar to Immigrants from Yemen are Tlingit-Haida (13.2%, a difference of 0.0%), Shoshone (13.2%, a difference of 0.060%), White/Caucasian (13.2%, a difference of 0.18%), Yakama (13.2%, a difference of 0.23%), and Yaqui (13.2%, a difference of 0.27%).
| Demographics | Rating | Rank | Female Disability |
| English | 0.0 /100 | #283 | Tragic 13.1% |
| Hmong | 0.0 /100 | #284 | Tragic 13.1% |
| Bangladeshis | 0.0 /100 | #285 | Tragic 13.1% |
| Fijians | 0.0 /100 | #286 | Tragic 13.1% |
| Yaqui | 0.0 /100 | #287 | Tragic 13.2% |
| Whites/Caucasians | 0.0 /100 | #288 | Tragic 13.2% |
| Tlingit-Haida | 0.0 /100 | #289 | Tragic 13.2% |
| Immigrants | Yemen | 0.0 /100 | #290 | Tragic 13.2% |
| Shoshone | 0.0 /100 | #291 | Tragic 13.2% |
| Yakama | 0.0 /100 | #292 | Tragic 13.2% |
| Marshallese | 0.0 /100 | #293 | Tragic 13.3% |
| Celtics | 0.0 /100 | #294 | Tragic 13.3% |
| French | 0.0 /100 | #295 | Tragic 13.3% |
| Nepalese | 0.0 /100 | #296 | Tragic 13.3% |
| Slovaks | 0.0 /100 | #297 | Tragic 13.3% |
Demographics Similar to Argentineans by Female Disability
In terms of female disability, the demographic groups most similar to Argentineans are Immigrants from Asia (11.0%, a difference of 0.040%), Immigrants from Argentina (11.0%, a difference of 0.070%), Immigrants from Turkey (11.1%, a difference of 0.40%), Venezuelan (11.0%, a difference of 0.64%), and Egyptian (11.1%, a difference of 0.67%).
| Demographics | Rating | Rank | Female Disability |
| Immigrants | Venezuela | 100.0 /100 | #19 | Exceptional 10.9% |
| Immigrants | Pakistan | 100.0 /100 | #20 | Exceptional 10.9% |
| Asians | 100.0 /100 | #21 | Exceptional 10.9% |
| Immigrants | Sri Lanka | 100.0 /100 | #22 | Exceptional 10.9% |
| Venezuelans | 100.0 /100 | #23 | Exceptional 11.0% |
| Immigrants | Argentina | 100.0 /100 | #24 | Exceptional 11.0% |
| Immigrants | Asia | 100.0 /100 | #25 | Exceptional 11.0% |
| Argentineans | 100.0 /100 | #26 | Exceptional 11.0% |
| Immigrants | Turkey | 100.0 /100 | #27 | Exceptional 11.1% |
| Egyptians | 100.0 /100 | #28 | Exceptional 11.1% |
| Immigrants | Malaysia | 100.0 /100 | #29 | Exceptional 11.1% |
| Turks | 100.0 /100 | #30 | Exceptional 11.1% |
| Immigrants | Kuwait | 100.0 /100 | #31 | Exceptional 11.1% |
| Immigrants | Australia | 100.0 /100 | #32 | Exceptional 11.1% |
| Immigrants | Egypt | 100.0 /100 | #33 | Exceptional 11.1% |