U.S. Virgin Islander vs Sri Lankan Disability
COMPARE
U.S. Virgin Islander
Sri Lankan
Disability
Disability Comparison
U.S. Virgin Islanders
Sri Lankans
12.5%
DISABILITY
0.2/ 100
METRIC RATING
265th/ 347
METRIC RANK
11.0%
DISABILITY
99.5/ 100
METRIC RATING
69th/ 347
METRIC RANK
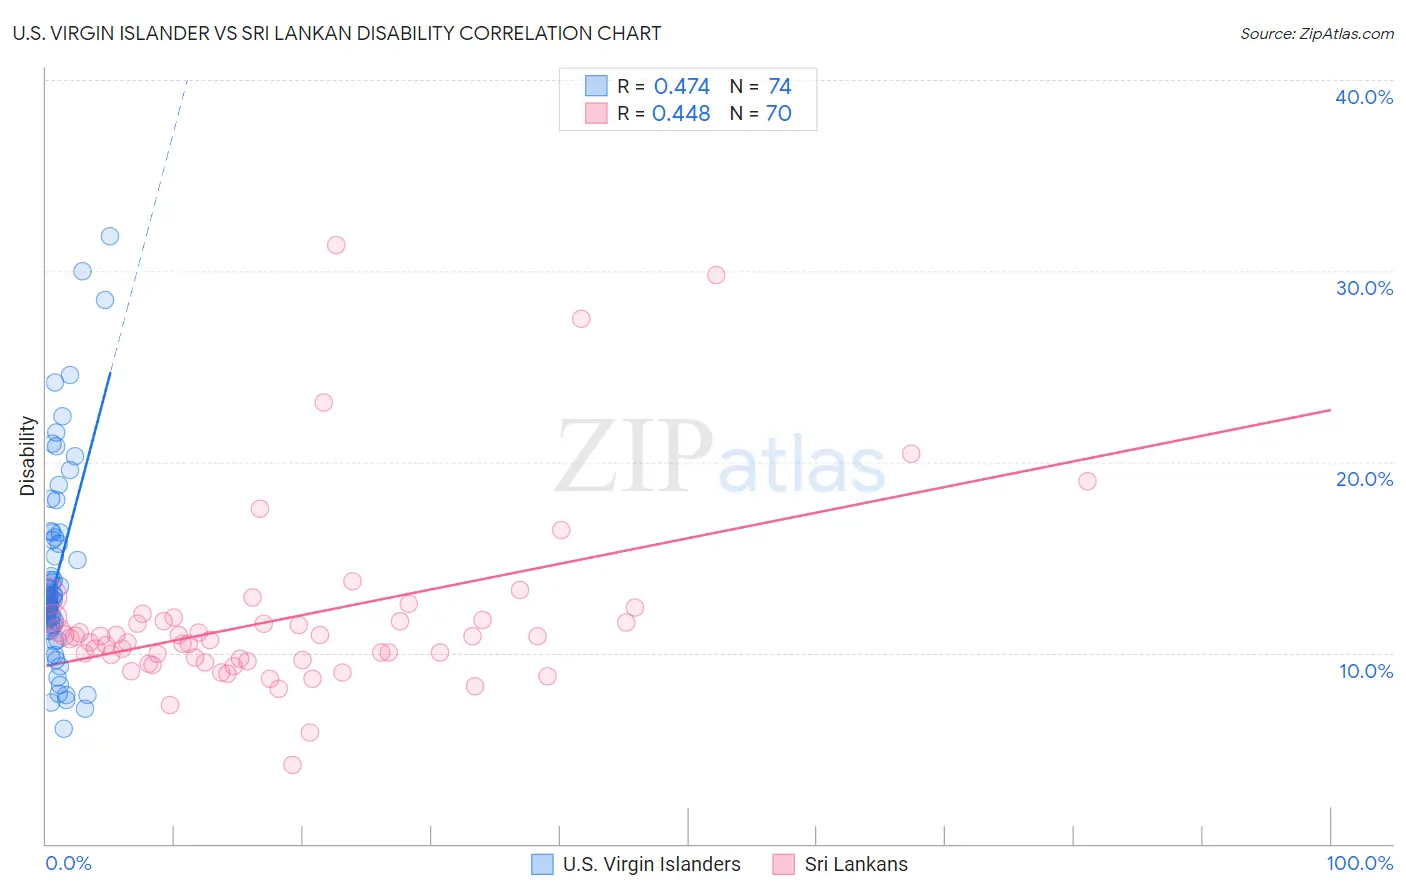
U.S. Virgin Islander vs Sri Lankan Disability Correlation Chart
The statistical analysis conducted on geographies consisting of 87,526,071 people shows a moderate positive correlation between the proportion of U.S. Virgin Islanders and percentage of population with a disability in the United States with a correlation coefficient (R) of 0.474 and weighted average of 12.5%. Similarly, the statistical analysis conducted on geographies consisting of 440,510,650 people shows a moderate positive correlation between the proportion of Sri Lankans and percentage of population with a disability in the United States with a correlation coefficient (R) of 0.448 and weighted average of 11.0%, a difference of 13.4%.
Disability Correlation Summary
| Measurement | U.S. Virgin Islander | Sri Lankan |
| Minimum | 6.0% | 4.1% |
| Maximum | 31.8% | 31.3% |
| Range | 25.8% | 27.2% |
| Mean | 14.0% | 11.8% |
| Median | 12.8% | 10.8% |
| Interquartile 25% (IQ1) | 11.5% | 9.6% |
| Interquartile 75% (IQ3) | 15.9% | 11.7% |
| Interquartile Range (IQR) | 4.5% | 2.1% |
| Standard Deviation (Sample) | 5.2% | 4.8% |
| Standard Deviation (Population) | 5.1% | 4.7% |
Similar Demographics by Disability
Demographics Similar to U.S. Virgin Islanders by Disability
In terms of disability, the demographic groups most similar to U.S. Virgin Islanders are Immigrants from Germany (12.5%, a difference of 0.020%), Hawaiian (12.5%, a difference of 0.13%), Czechoslovakian (12.5%, a difference of 0.16%), Spaniard (12.5%, a difference of 0.24%), and Native Hawaiian (12.5%, a difference of 0.33%).
| Demographics | Rating | Rank | Disability |
| Slavs | 0.5 /100 | #258 | Tragic 12.4% |
| Canadians | 0.4 /100 | #259 | Tragic 12.4% |
| Immigrants | Liberia | 0.4 /100 | #260 | Tragic 12.4% |
| Scandinavians | 0.4 /100 | #261 | Tragic 12.4% |
| Native Hawaiians | 0.3 /100 | #262 | Tragic 12.5% |
| Hawaiians | 0.2 /100 | #263 | Tragic 12.5% |
| Immigrants | Germany | 0.2 /100 | #264 | Tragic 12.5% |
| U.S. Virgin Islanders | 0.2 /100 | #265 | Tragic 12.5% |
| Czechoslovakians | 0.2 /100 | #266 | Tragic 12.5% |
| Spaniards | 0.2 /100 | #267 | Tragic 12.5% |
| Bangladeshis | 0.1 /100 | #268 | Tragic 12.6% |
| Immigrants | Dominican Republic | 0.1 /100 | #269 | Tragic 12.6% |
| Portuguese | 0.1 /100 | #270 | Tragic 12.6% |
| Immigrants | Yemen | 0.1 /100 | #271 | Tragic 12.6% |
| Dominicans | 0.0 /100 | #272 | Tragic 12.7% |
Demographics Similar to Sri Lankans by Disability
In terms of disability, the demographic groups most similar to Sri Lankans are Immigrants from France (11.0%, a difference of 0.080%), Immigrants from Lebanon (11.0%, a difference of 0.090%), Immigrants from Chile (11.0%, a difference of 0.18%), Immigrants from Afghanistan (11.0%, a difference of 0.21%), and Immigrants from Bangladesh (11.0%, a difference of 0.21%).
| Demographics | Rating | Rank | Disability |
| Immigrants | Northern Africa | 99.7 /100 | #62 | Exceptional 10.9% |
| Immigrants | Eritrea | 99.7 /100 | #63 | Exceptional 11.0% |
| Immigrants | Sweden | 99.6 /100 | #64 | Exceptional 11.0% |
| Bulgarians | 99.6 /100 | #65 | Exceptional 11.0% |
| Laotians | 99.6 /100 | #66 | Exceptional 11.0% |
| Colombians | 99.6 /100 | #67 | Exceptional 11.0% |
| Immigrants | Afghanistan | 99.6 /100 | #68 | Exceptional 11.0% |
| Sri Lankans | 99.5 /100 | #69 | Exceptional 11.0% |
| Immigrants | France | 99.4 /100 | #70 | Exceptional 11.0% |
| Immigrants | Lebanon | 99.4 /100 | #71 | Exceptional 11.0% |
| Immigrants | Chile | 99.4 /100 | #72 | Exceptional 11.0% |
| Immigrants | Bangladesh | 99.4 /100 | #73 | Exceptional 11.0% |
| Immigrants | Serbia | 99.4 /100 | #74 | Exceptional 11.0% |
| Immigrants | Vietnam | 99.4 /100 | #75 | Exceptional 11.0% |
| Sierra Leoneans | 99.3 /100 | #76 | Exceptional 11.0% |