Bolivian vs Egyptian Disability
COMPARE
Bolivian
Egyptian
Disability
Disability Comparison
Bolivians
Egyptians
10.0%
DISABILITY
100.0/ 100
METRIC RATING
8th/ 347
METRIC RANK
10.6%
DISABILITY
100.0/ 100
METRIC RATING
28th/ 347
METRIC RANK
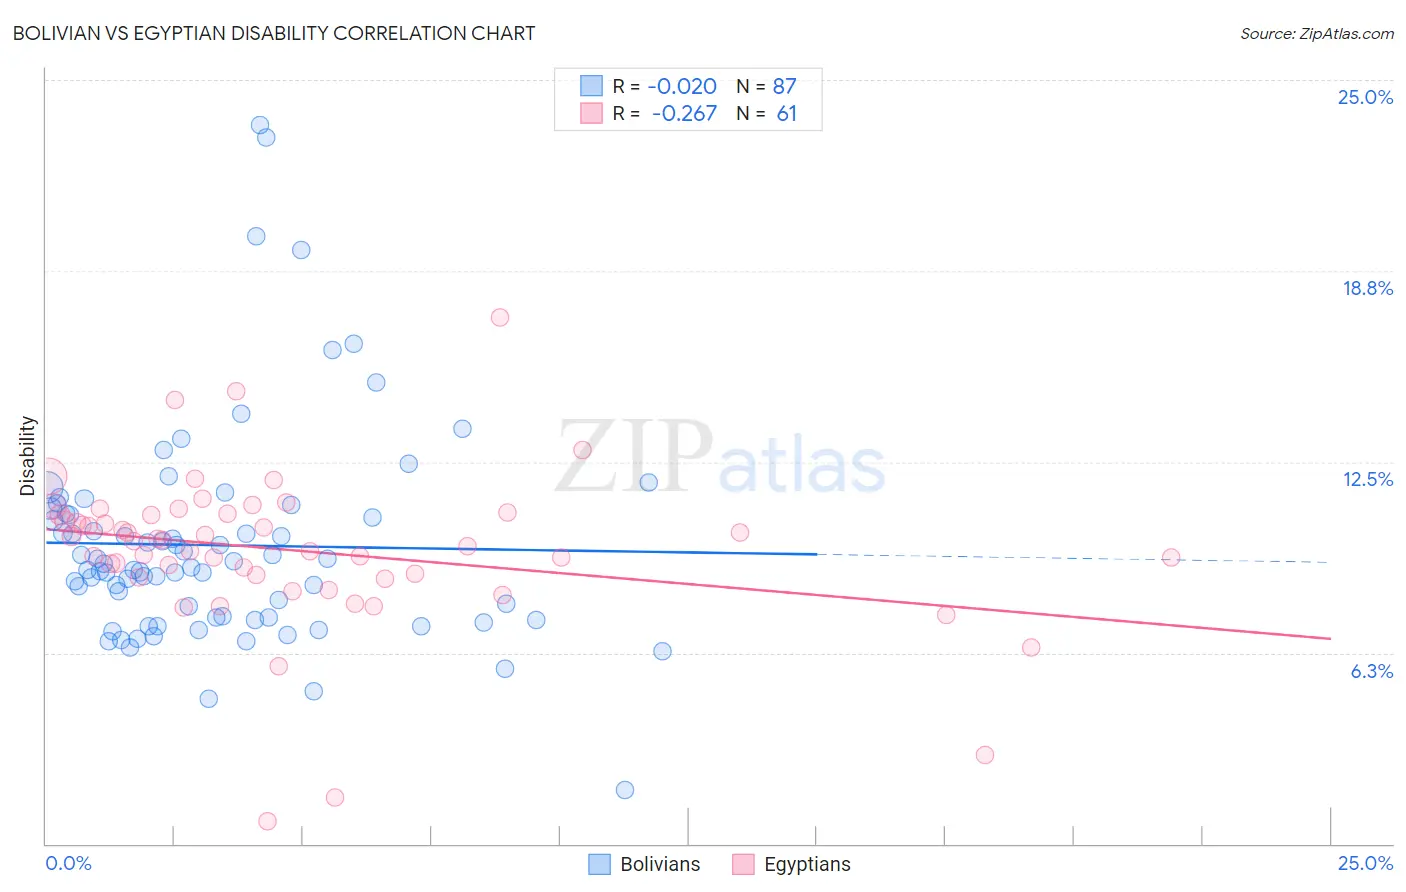
Bolivian vs Egyptian Disability Correlation Chart
The statistical analysis conducted on geographies consisting of 184,660,652 people shows no correlation between the proportion of Bolivians and percentage of population with a disability in the United States with a correlation coefficient (R) of -0.020 and weighted average of 10.0%. Similarly, the statistical analysis conducted on geographies consisting of 276,915,962 people shows a weak negative correlation between the proportion of Egyptians and percentage of population with a disability in the United States with a correlation coefficient (R) of -0.267 and weighted average of 10.6%, a difference of 6.0%.
Disability Correlation Summary
| Measurement | Bolivian | Egyptian |
| Minimum | 1.7% | 0.75% |
| Maximum | 23.5% | 17.2% |
| Range | 21.8% | 16.5% |
| Mean | 9.8% | 9.6% |
| Median | 9.1% | 9.9% |
| Interquartile 25% (IQ1) | 7.4% | 8.8% |
| Interquartile 75% (IQ3) | 10.8% | 10.8% |
| Interquartile Range (IQR) | 3.4% | 2.0% |
| Standard Deviation (Sample) | 3.6% | 2.6% |
| Standard Deviation (Population) | 3.5% | 2.6% |
Demographics Similar to Bolivians and Egyptians by Disability
In terms of disability, the demographic groups most similar to Bolivians are Immigrants from Hong Kong (10.0%, a difference of 0.30%), Immigrants from China (10.1%, a difference of 1.1%), Iranian (10.1%, a difference of 1.1%), Immigrants from Israel (10.1%, a difference of 1.4%), and Immigrants from Eastern Asia (10.2%, a difference of 1.6%). Similarly, the demographic groups most similar to Egyptians are Cypriot (10.6%, a difference of 0.13%), Argentinean (10.6%, a difference of 0.14%), Immigrants from Malaysia (10.6%, a difference of 0.19%), Venezuelan (10.5%, a difference of 0.57%), and Immigrants from Asia (10.5%, a difference of 0.71%).
| Demographics | Rating | Rank | Disability |
| Bolivians | 100.0 /100 | #8 | Exceptional 10.0% |
| Immigrants | Hong Kong | 100.0 /100 | #9 | Exceptional 10.0% |
| Immigrants | China | 100.0 /100 | #10 | Exceptional 10.1% |
| Iranians | 100.0 /100 | #11 | Exceptional 10.1% |
| Immigrants | Israel | 100.0 /100 | #12 | Exceptional 10.1% |
| Immigrants | Eastern Asia | 100.0 /100 | #13 | Exceptional 10.2% |
| Immigrants | Korea | 100.0 /100 | #14 | Exceptional 10.2% |
| Okinawans | 100.0 /100 | #15 | Exceptional 10.3% |
| Indians (Asian) | 100.0 /100 | #16 | Exceptional 10.3% |
| Immigrants | Iran | 100.0 /100 | #17 | Exceptional 10.3% |
| Burmese | 100.0 /100 | #18 | Exceptional 10.4% |
| Immigrants | Pakistan | 100.0 /100 | #19 | Exceptional 10.4% |
| Immigrants | Venezuela | 100.0 /100 | #20 | Exceptional 10.4% |
| Asians | 100.0 /100 | #21 | Exceptional 10.4% |
| Immigrants | Sri Lanka | 100.0 /100 | #22 | Exceptional 10.5% |
| Immigrants | Asia | 100.0 /100 | #23 | Exceptional 10.5% |
| Venezuelans | 100.0 /100 | #24 | Exceptional 10.5% |
| Immigrants | Malaysia | 100.0 /100 | #25 | Exceptional 10.6% |
| Argentineans | 100.0 /100 | #26 | Exceptional 10.6% |
| Cypriots | 100.0 /100 | #27 | Exceptional 10.6% |
| Egyptians | 100.0 /100 | #28 | Exceptional 10.6% |