Spaniard vs Egyptian Disability
COMPARE
Spaniard
Egyptian
Disability
Disability Comparison
Spaniards
Egyptians
12.5%
DISABILITY
0.2/ 100
METRIC RATING
267th/ 347
METRIC RANK
10.6%
DISABILITY
100.0/ 100
METRIC RATING
28th/ 347
METRIC RANK
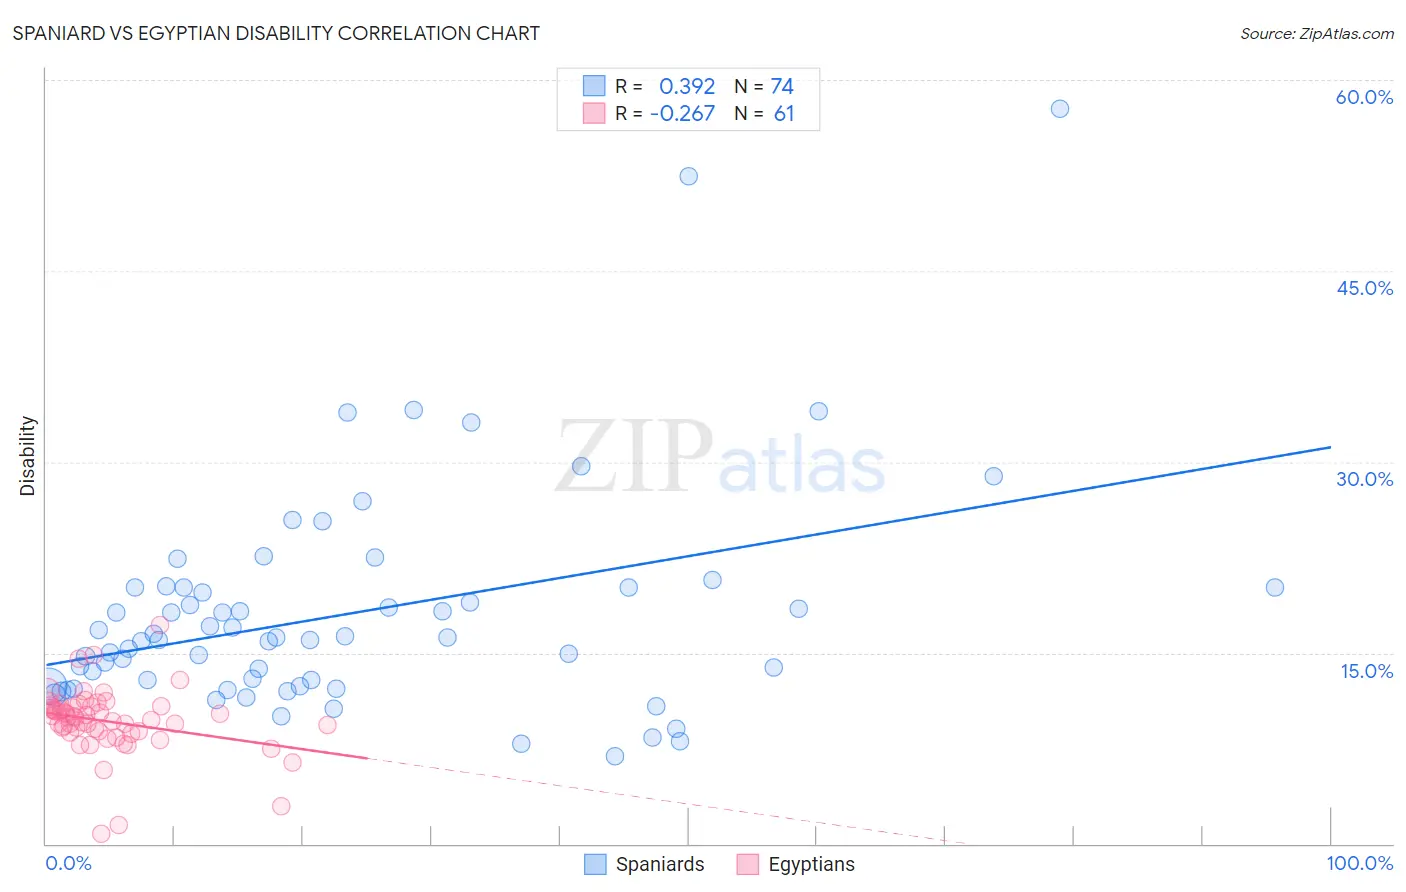
Spaniard vs Egyptian Disability Correlation Chart
The statistical analysis conducted on geographies consisting of 443,457,716 people shows a mild positive correlation between the proportion of Spaniards and percentage of population with a disability in the United States with a correlation coefficient (R) of 0.392 and weighted average of 12.5%. Similarly, the statistical analysis conducted on geographies consisting of 276,915,962 people shows a weak negative correlation between the proportion of Egyptians and percentage of population with a disability in the United States with a correlation coefficient (R) of -0.267 and weighted average of 10.6%, a difference of 18.1%.
Disability Correlation Summary
| Measurement | Spaniard | Egyptian |
| Minimum | 6.9% | 0.75% |
| Maximum | 57.8% | 17.2% |
| Range | 50.9% | 16.5% |
| Mean | 18.1% | 9.6% |
| Median | 16.1% | 9.9% |
| Interquartile 25% (IQ1) | 12.4% | 8.8% |
| Interquartile 75% (IQ3) | 20.1% | 10.8% |
| Interquartile Range (IQR) | 7.7% | 2.0% |
| Standard Deviation (Sample) | 8.8% | 2.6% |
| Standard Deviation (Population) | 8.7% | 2.6% |
Similar Demographics by Disability
Demographics Similar to Spaniards by Disability
In terms of disability, the demographic groups most similar to Spaniards are Czechoslovakian (12.5%, a difference of 0.070%), U.S. Virgin Islander (12.5%, a difference of 0.24%), Immigrants from Germany (12.5%, a difference of 0.26%), Bangladeshi (12.6%, a difference of 0.33%), and Hawaiian (12.5%, a difference of 0.37%).
| Demographics | Rating | Rank | Disability |
| Immigrants | Liberia | 0.4 /100 | #260 | Tragic 12.4% |
| Scandinavians | 0.4 /100 | #261 | Tragic 12.4% |
| Native Hawaiians | 0.3 /100 | #262 | Tragic 12.5% |
| Hawaiians | 0.2 /100 | #263 | Tragic 12.5% |
| Immigrants | Germany | 0.2 /100 | #264 | Tragic 12.5% |
| U.S. Virgin Islanders | 0.2 /100 | #265 | Tragic 12.5% |
| Czechoslovakians | 0.2 /100 | #266 | Tragic 12.5% |
| Spaniards | 0.2 /100 | #267 | Tragic 12.5% |
| Bangladeshis | 0.1 /100 | #268 | Tragic 12.6% |
| Immigrants | Dominican Republic | 0.1 /100 | #269 | Tragic 12.6% |
| Portuguese | 0.1 /100 | #270 | Tragic 12.6% |
| Immigrants | Yemen | 0.1 /100 | #271 | Tragic 12.6% |
| Dominicans | 0.0 /100 | #272 | Tragic 12.7% |
| Finns | 0.0 /100 | #273 | Tragic 12.7% |
| Nepalese | 0.0 /100 | #274 | Tragic 12.8% |
Demographics Similar to Egyptians by Disability
In terms of disability, the demographic groups most similar to Egyptians are Cypriot (10.6%, a difference of 0.13%), Immigrants from Argentina (10.6%, a difference of 0.13%), Argentinean (10.6%, a difference of 0.14%), Immigrants from Malaysia (10.6%, a difference of 0.19%), and Immigrants from Turkey (10.6%, a difference of 0.28%).
| Demographics | Rating | Rank | Disability |
| Asians | 100.0 /100 | #21 | Exceptional 10.4% |
| Immigrants | Sri Lanka | 100.0 /100 | #22 | Exceptional 10.5% |
| Immigrants | Asia | 100.0 /100 | #23 | Exceptional 10.5% |
| Venezuelans | 100.0 /100 | #24 | Exceptional 10.5% |
| Immigrants | Malaysia | 100.0 /100 | #25 | Exceptional 10.6% |
| Argentineans | 100.0 /100 | #26 | Exceptional 10.6% |
| Cypriots | 100.0 /100 | #27 | Exceptional 10.6% |
| Egyptians | 100.0 /100 | #28 | Exceptional 10.6% |
| Immigrants | Argentina | 100.0 /100 | #29 | Exceptional 10.6% |
| Immigrants | Turkey | 100.0 /100 | #30 | Exceptional 10.6% |
| Immigrants | Egypt | 100.0 /100 | #31 | Exceptional 10.6% |
| Paraguayans | 100.0 /100 | #32 | Exceptional 10.6% |
| Immigrants | Kuwait | 100.0 /100 | #33 | Exceptional 10.7% |
| Immigrants | Ethiopia | 100.0 /100 | #34 | Exceptional 10.7% |
| Immigrants | Indonesia | 100.0 /100 | #35 | Exceptional 10.7% |