Immigrants from Portugal vs Egyptian Disability
COMPARE
Immigrants from Portugal
Egyptian
Disability
Disability Comparison
Immigrants from Portugal
Egyptians
12.9%
DISABILITY
0.0/ 100
METRIC RATING
281st/ 347
METRIC RANK
10.6%
DISABILITY
100.0/ 100
METRIC RATING
28th/ 347
METRIC RANK
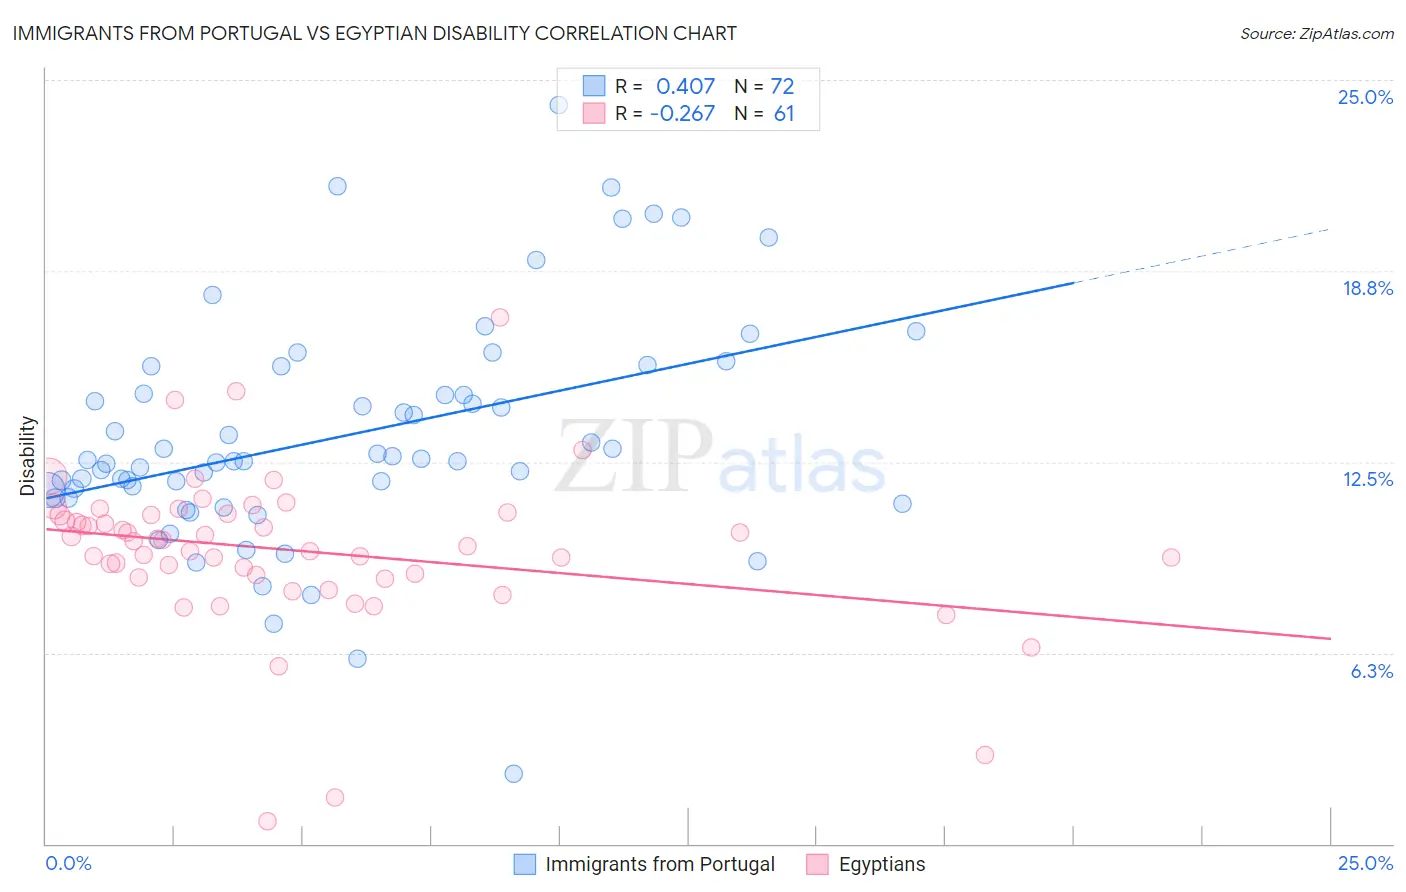
Immigrants from Portugal vs Egyptian Disability Correlation Chart
The statistical analysis conducted on geographies consisting of 174,786,483 people shows a moderate positive correlation between the proportion of Immigrants from Portugal and percentage of population with a disability in the United States with a correlation coefficient (R) of 0.407 and weighted average of 12.9%. Similarly, the statistical analysis conducted on geographies consisting of 276,915,962 people shows a weak negative correlation between the proportion of Egyptians and percentage of population with a disability in the United States with a correlation coefficient (R) of -0.267 and weighted average of 10.6%, a difference of 21.3%.
Disability Correlation Summary
| Measurement | Immigrants from Portugal | Egyptian |
| Minimum | 2.3% | 0.75% |
| Maximum | 24.2% | 17.2% |
| Range | 21.9% | 16.5% |
| Mean | 13.4% | 9.6% |
| Median | 12.6% | 9.9% |
| Interquartile 25% (IQ1) | 11.4% | 8.8% |
| Interquartile 75% (IQ3) | 15.2% | 10.8% |
| Interquartile Range (IQR) | 3.7% | 2.0% |
| Standard Deviation (Sample) | 3.8% | 2.6% |
| Standard Deviation (Population) | 3.7% | 2.6% |
Similar Demographics by Disability
Demographics Similar to Immigrants from Portugal by Disability
In terms of disability, the demographic groups most similar to Immigrants from Portugal are Spanish (12.8%, a difference of 0.14%), Scottish (12.9%, a difference of 0.14%), Irish (12.9%, a difference of 0.16%), Fijian (12.8%, a difference of 0.19%), and German (12.8%, a difference of 0.29%).
| Demographics | Rating | Rank | Disability |
| Nepalese | 0.0 /100 | #274 | Tragic 12.8% |
| Sioux | 0.0 /100 | #275 | Tragic 12.8% |
| Hmong | 0.0 /100 | #276 | Tragic 12.8% |
| Dutch | 0.0 /100 | #277 | Tragic 12.8% |
| Germans | 0.0 /100 | #278 | Tragic 12.8% |
| Fijians | 0.0 /100 | #279 | Tragic 12.8% |
| Spanish | 0.0 /100 | #280 | Tragic 12.8% |
| Immigrants | Portugal | 0.0 /100 | #281 | Tragic 12.9% |
| Scottish | 0.0 /100 | #282 | Tragic 12.9% |
| Irish | 0.0 /100 | #283 | Tragic 12.9% |
| Welsh | 0.0 /100 | #284 | Tragic 12.9% |
| Crow | 0.0 /100 | #285 | Tragic 12.9% |
| English | 0.0 /100 | #286 | Tragic 13.0% |
| Africans | 0.0 /100 | #287 | Tragic 13.0% |
| Whites/Caucasians | 0.0 /100 | #288 | Tragic 13.0% |
Demographics Similar to Egyptians by Disability
In terms of disability, the demographic groups most similar to Egyptians are Cypriot (10.6%, a difference of 0.13%), Immigrants from Argentina (10.6%, a difference of 0.13%), Argentinean (10.6%, a difference of 0.14%), Immigrants from Malaysia (10.6%, a difference of 0.19%), and Immigrants from Turkey (10.6%, a difference of 0.28%).
| Demographics | Rating | Rank | Disability |
| Asians | 100.0 /100 | #21 | Exceptional 10.4% |
| Immigrants | Sri Lanka | 100.0 /100 | #22 | Exceptional 10.5% |
| Immigrants | Asia | 100.0 /100 | #23 | Exceptional 10.5% |
| Venezuelans | 100.0 /100 | #24 | Exceptional 10.5% |
| Immigrants | Malaysia | 100.0 /100 | #25 | Exceptional 10.6% |
| Argentineans | 100.0 /100 | #26 | Exceptional 10.6% |
| Cypriots | 100.0 /100 | #27 | Exceptional 10.6% |
| Egyptians | 100.0 /100 | #28 | Exceptional 10.6% |
| Immigrants | Argentina | 100.0 /100 | #29 | Exceptional 10.6% |
| Immigrants | Turkey | 100.0 /100 | #30 | Exceptional 10.6% |
| Immigrants | Egypt | 100.0 /100 | #31 | Exceptional 10.6% |
| Paraguayans | 100.0 /100 | #32 | Exceptional 10.6% |
| Immigrants | Kuwait | 100.0 /100 | #33 | Exceptional 10.7% |
| Immigrants | Ethiopia | 100.0 /100 | #34 | Exceptional 10.7% |
| Immigrants | Indonesia | 100.0 /100 | #35 | Exceptional 10.7% |