Shoshone vs Arapaho Disability
COMPARE
Shoshone
Arapaho
Disability
Disability Comparison
Shoshone
Arapaho
13.5%
DISABILITY
0.0/ 100
METRIC RATING
307th/ 347
METRIC RANK
13.2%
DISABILITY
0.0/ 100
METRIC RATING
302nd/ 347
METRIC RANK
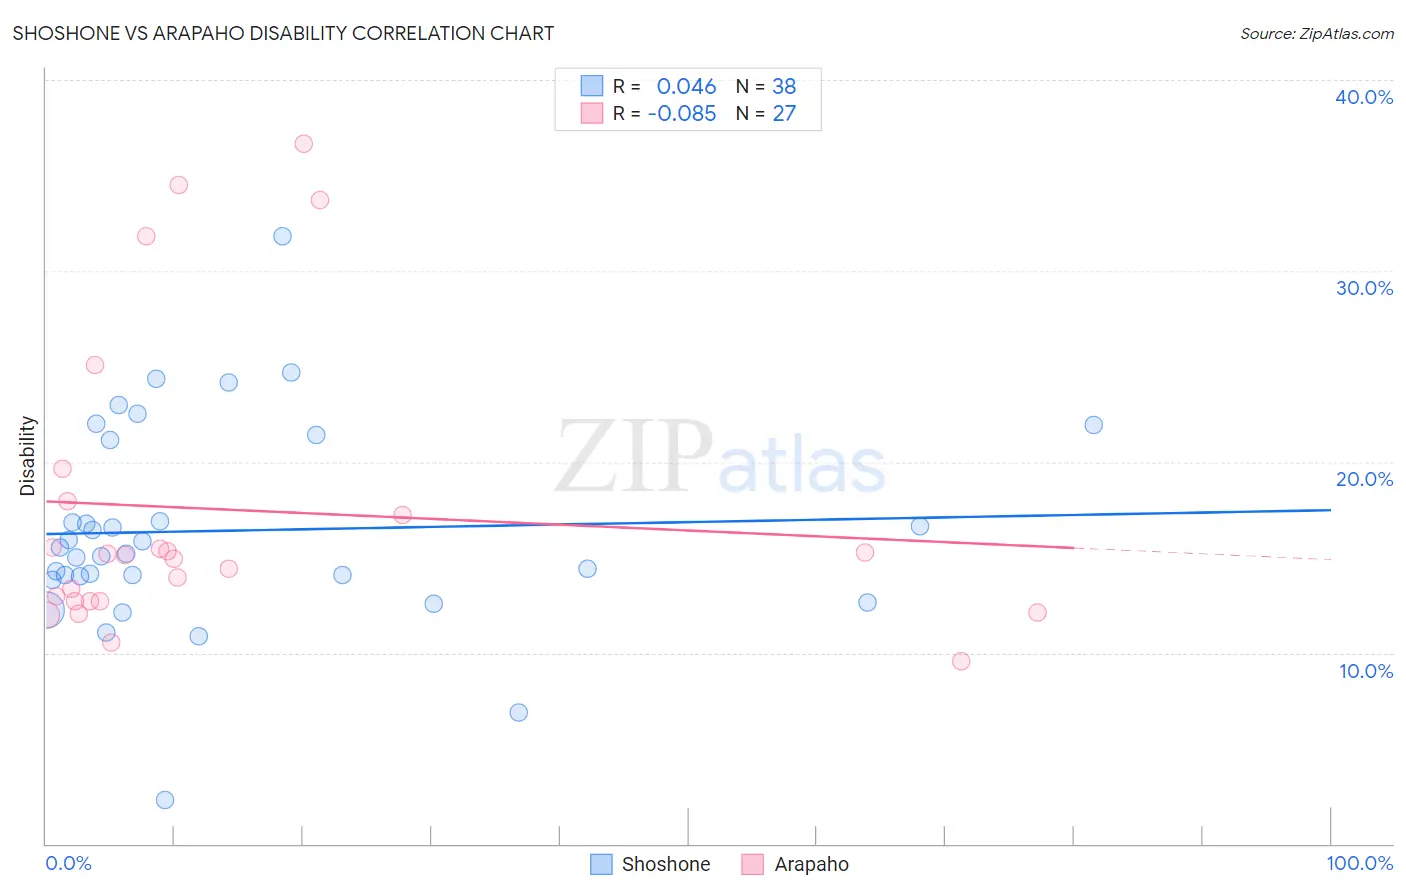
Shoshone vs Arapaho Disability Correlation Chart
The statistical analysis conducted on geographies consisting of 66,619,944 people shows no correlation between the proportion of Shoshone and percentage of population with a disability in the United States with a correlation coefficient (R) of 0.046 and weighted average of 13.5%. Similarly, the statistical analysis conducted on geographies consisting of 29,780,325 people shows a slight negative correlation between the proportion of Arapaho and percentage of population with a disability in the United States with a correlation coefficient (R) of -0.085 and weighted average of 13.2%, a difference of 2.3%.
Disability Correlation Summary
| Measurement | Shoshone | Arapaho |
| Minimum | 2.3% | 9.5% |
| Maximum | 31.8% | 36.7% |
| Range | 29.5% | 27.1% |
| Mean | 16.4% | 17.5% |
| Median | 15.3% | 15.1% |
| Interquartile 25% (IQ1) | 14.0% | 12.7% |
| Interquartile 75% (IQ3) | 21.2% | 17.9% |
| Interquartile Range (IQR) | 7.1% | 5.2% |
| Standard Deviation (Sample) | 5.4% | 7.7% |
| Standard Deviation (Population) | 5.3% | 7.6% |
Demographics Similar to Shoshone and Arapaho by Disability
In terms of disability, the demographic groups most similar to Shoshone are Cape Verdean (13.5%, a difference of 0.050%), French American Indian (13.5%, a difference of 0.090%), Tlingit-Haida (13.5%, a difference of 0.18%), French Canadian (13.4%, a difference of 0.66%), and Blackfeet (13.6%, a difference of 0.71%). Similarly, the demographic groups most similar to Arapaho are Immigrants from Micronesia (13.2%, a difference of 0.21%), Pennsylvania German (13.2%, a difference of 0.29%), French (13.2%, a difference of 0.34%), Alaska Native (13.2%, a difference of 0.36%), and Hopi (13.2%, a difference of 0.37%).
| Demographics | Rating | Rank | Disability |
| Celtics | 0.0 /100 | #294 | Tragic 13.1% |
| Immigrants | Nonimmigrants | 0.0 /100 | #295 | Tragic 13.2% |
| Central American Indians | 0.0 /100 | #296 | Tragic 13.2% |
| Hopi | 0.0 /100 | #297 | Tragic 13.2% |
| Alaska Natives | 0.0 /100 | #298 | Tragic 13.2% |
| French | 0.0 /100 | #299 | Tragic 13.2% |
| Pennsylvania Germans | 0.0 /100 | #300 | Tragic 13.2% |
| Immigrants | Micronesia | 0.0 /100 | #301 | Tragic 13.2% |
| Arapaho | 0.0 /100 | #302 | Tragic 13.2% |
| Scotch-Irish | 0.0 /100 | #303 | Tragic 13.3% |
| Yakama | 0.0 /100 | #304 | Tragic 13.4% |
| French Canadians | 0.0 /100 | #305 | Tragic 13.4% |
| Cape Verdeans | 0.0 /100 | #306 | Tragic 13.5% |
| Shoshone | 0.0 /100 | #307 | Tragic 13.5% |
| French American Indians | 0.0 /100 | #308 | Tragic 13.5% |
| Tlingit-Haida | 0.0 /100 | #309 | Tragic 13.5% |
| Blackfeet | 0.0 /100 | #310 | Tragic 13.6% |
| Delaware | 0.0 /100 | #311 | Tragic 13.6% |
| Spanish Americans | 0.0 /100 | #312 | Tragic 13.6% |
| Cree | 0.0 /100 | #313 | Tragic 13.7% |
| Blacks/African Americans | 0.0 /100 | #314 | Tragic 13.7% |