Welsh vs Cheyenne Disability Age Under 5
COMPARE
Welsh
Cheyenne
Disability Age Under 5
Disability Age Under 5 Comparison
Welsh
Cheyenne
1.6%
DISABILITY AGE UNDER 5
0.0/ 100
METRIC RATING
302nd/ 347
METRIC RANK
1.5%
DISABILITY AGE UNDER 5
0.0/ 100
METRIC RATING
282nd/ 347
METRIC RANK
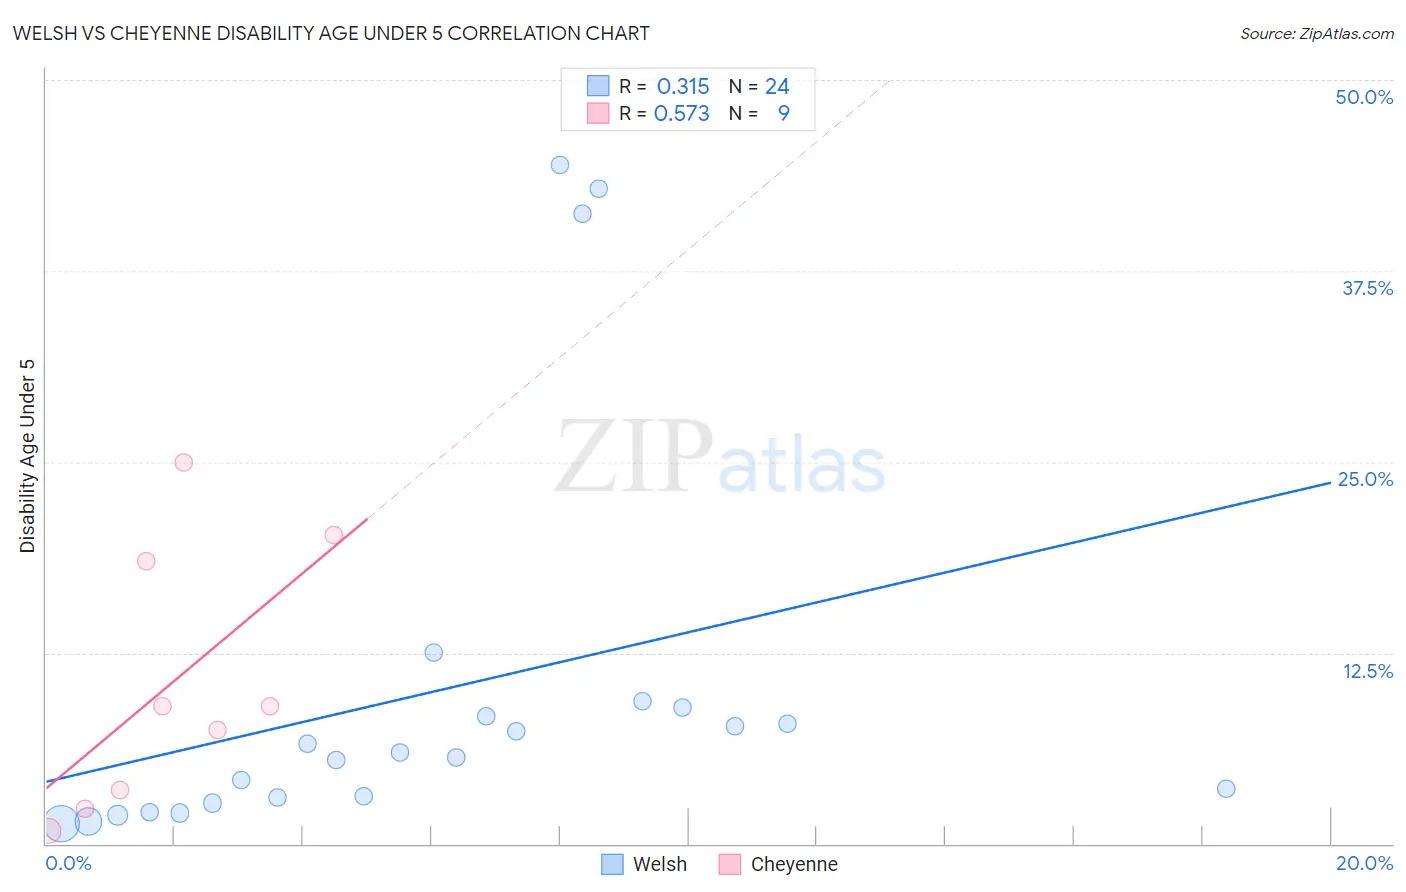
Welsh vs Cheyenne Disability Age Under 5 Correlation Chart
The statistical analysis conducted on geographies consisting of 248,340,053 people shows a mild positive correlation between the proportion of Welsh and percentage of population with a disability under the age of 5 in the United States with a correlation coefficient (R) of 0.315 and weighted average of 1.6%. Similarly, the statistical analysis conducted on geographies consisting of 66,176,849 people shows a substantial positive correlation between the proportion of Cheyenne and percentage of population with a disability under the age of 5 in the United States with a correlation coefficient (R) of 0.573 and weighted average of 1.5%, a difference of 7.4%.
Disability Age Under 5 Correlation Summary
| Measurement | Welsh | Cheyenne |
| Minimum | 1.3% | 0.85% |
| Maximum | 44.4% | 25.0% |
| Range | 43.1% | 24.1% |
| Mean | 10.0% | 10.6% |
| Median | 5.8% | 9.0% |
| Interquartile 25% (IQ1) | 2.8% | 2.9% |
| Interquartile 75% (IQ3) | 8.6% | 19.4% |
| Interquartile Range (IQR) | 5.8% | 16.4% |
| Standard Deviation (Sample) | 13.0% | 8.6% |
| Standard Deviation (Population) | 12.8% | 8.1% |
Demographics Similar to Welsh and Cheyenne by Disability Age Under 5
In terms of disability age under 5, the demographic groups most similar to Welsh are German Russian (1.6%, a difference of 0.12%), Shoshone (1.6%, a difference of 0.56%), Portuguese (1.6%, a difference of 0.89%), Cajun (1.6%, a difference of 1.5%), and Nonimmigrants (1.6%, a difference of 1.5%). Similarly, the demographic groups most similar to Cheyenne are Delaware (1.5%, a difference of 0.19%), European (1.5%, a difference of 0.25%), Croatian (1.5%, a difference of 1.4%), Tlingit-Haida (1.5%, a difference of 1.7%), and Scandinavian (1.5%, a difference of 1.7%).
| Demographics | Rating | Rank | Disability Age Under 5 |
| Cheyenne | 0.0 /100 | #282 | Tragic 1.5% |
| Delaware | 0.0 /100 | #283 | Tragic 1.5% |
| Europeans | 0.0 /100 | #284 | Tragic 1.5% |
| Croatians | 0.0 /100 | #285 | Tragic 1.5% |
| Tlingit-Haida | 0.0 /100 | #286 | Tragic 1.5% |
| Scandinavians | 0.0 /100 | #287 | Tragic 1.5% |
| Estonians | 0.0 /100 | #288 | Tragic 1.5% |
| Hungarians | 0.0 /100 | #289 | Tragic 1.5% |
| Czechs | 0.0 /100 | #290 | Tragic 1.5% |
| Northern Europeans | 0.0 /100 | #291 | Tragic 1.6% |
| Italians | 0.0 /100 | #292 | Tragic 1.6% |
| Lithuanians | 0.0 /100 | #293 | Tragic 1.6% |
| Swedes | 0.0 /100 | #294 | Tragic 1.6% |
| Finns | 0.0 /100 | #295 | Tragic 1.6% |
| Poles | 0.0 /100 | #296 | Tragic 1.6% |
| Immigrants | Nonimmigrants | 0.0 /100 | #297 | Tragic 1.6% |
| Cajuns | 0.0 /100 | #298 | Tragic 1.6% |
| Portuguese | 0.0 /100 | #299 | Tragic 1.6% |
| Shoshone | 0.0 /100 | #300 | Tragic 1.6% |
| German Russians | 0.0 /100 | #301 | Tragic 1.6% |
| Welsh | 0.0 /100 | #302 | Tragic 1.6% |