Welsh vs Cheyenne Per Capita Income
COMPARE
Welsh
Cheyenne
Per Capita Income
Per Capita Income Comparison
Welsh
Cheyenne
$43,233
PER CAPITA INCOME
38.2/ 100
METRIC RATING
181st/ 347
METRIC RANK
$35,276
PER CAPITA INCOME
0.0/ 100
METRIC RATING
323rd/ 347
METRIC RANK
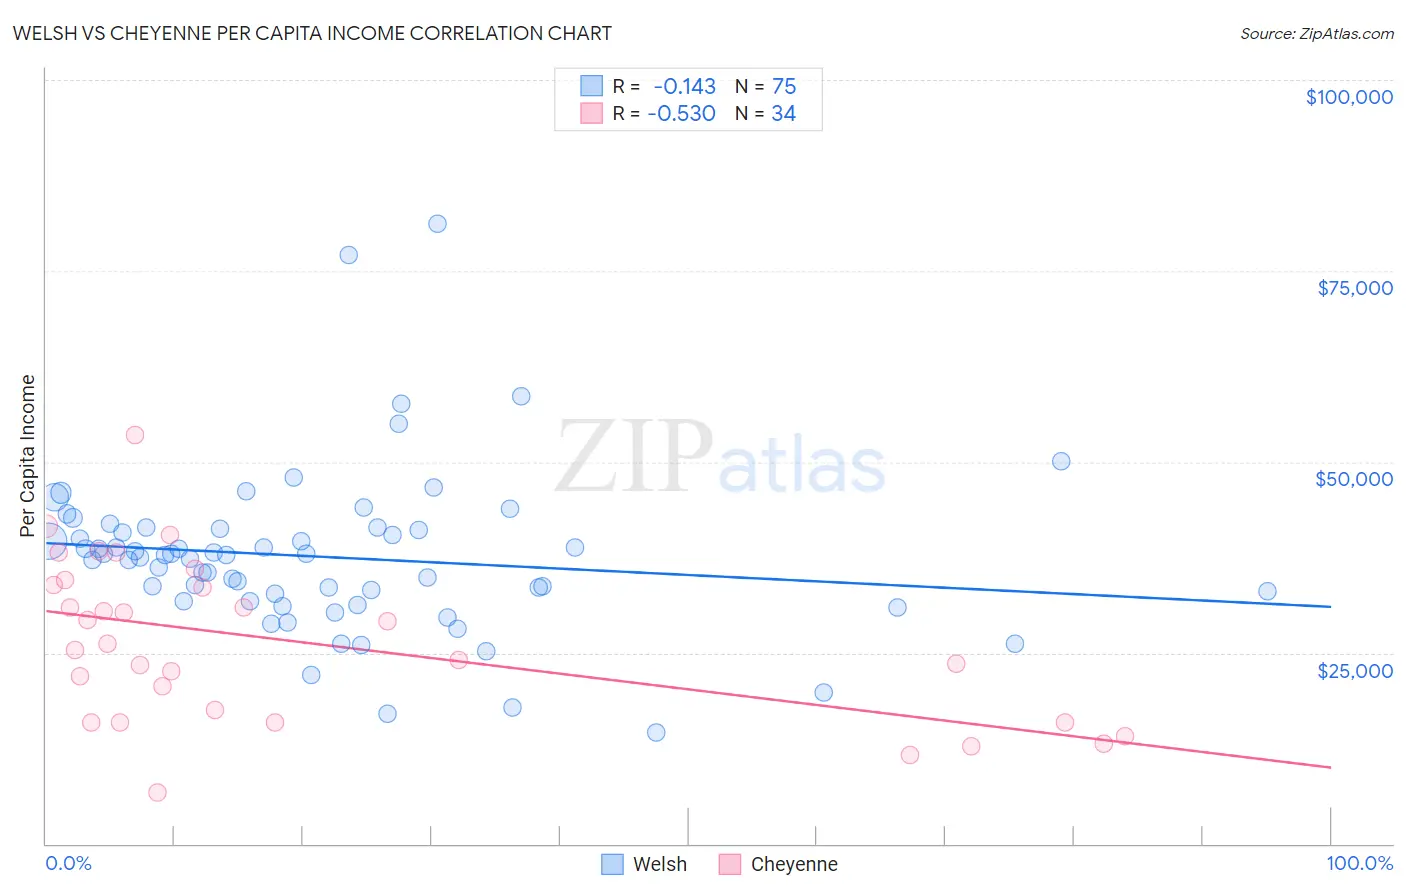
Welsh vs Cheyenne Per Capita Income Correlation Chart
The statistical analysis conducted on geographies consisting of 528,640,565 people shows a poor negative correlation between the proportion of Welsh and per capita income in the United States with a correlation coefficient (R) of -0.143 and weighted average of $43,233. Similarly, the statistical analysis conducted on geographies consisting of 80,722,590 people shows a substantial negative correlation between the proportion of Cheyenne and per capita income in the United States with a correlation coefficient (R) of -0.530 and weighted average of $35,276, a difference of 22.6%.
Per Capita Income Correlation Summary
| Measurement | Welsh | Cheyenne |
| Minimum | $14,496 | $6,772 |
| Maximum | $81,151 | $53,471 |
| Range | $66,655 | $46,699 |
| Mean | $37,545 | $26,352 |
| Median | $37,753 | $25,776 |
| Interquartile 25% (IQ1) | $31,788 | $15,918 |
| Interquartile 75% (IQ3) | $41,266 | $33,955 |
| Interquartile Range (IQR) | $9,478 | $18,037 |
| Standard Deviation (Sample) | $10,767 | $10,544 |
| Standard Deviation (Population) | $10,695 | $10,388 |
Similar Demographics by Per Capita Income
Demographics Similar to Welsh by Per Capita Income
In terms of per capita income, the demographic groups most similar to Welsh are Immigrants from Vietnam ($43,229, a difference of 0.010%), German ($43,067, a difference of 0.38%), Sierra Leonean ($43,405, a difference of 0.40%), Spaniard ($43,028, a difference of 0.48%), and Immigrants ($43,010, a difference of 0.52%).
| Demographics | Rating | Rank | Per Capita Income |
| Colombians | 50.0 /100 | #174 | Average $43,661 |
| Celtics | 48.9 /100 | #175 | Average $43,621 |
| Immigrants | South Eastern Asia | 46.6 /100 | #176 | Average $43,539 |
| Tlingit-Haida | 45.9 /100 | #177 | Average $43,516 |
| Immigrants | Costa Rica | 44.5 /100 | #178 | Average $43,464 |
| Finns | 44.4 /100 | #179 | Average $43,461 |
| Sierra Leoneans | 42.9 /100 | #180 | Average $43,405 |
| Welsh | 38.2 /100 | #181 | Fair $43,233 |
| Immigrants | Vietnam | 38.1 /100 | #182 | Fair $43,229 |
| Germans | 33.9 /100 | #183 | Fair $43,067 |
| Spaniards | 32.9 /100 | #184 | Fair $43,028 |
| Immigrants | Immigrants | 32.5 /100 | #185 | Fair $43,010 |
| French Canadians | 32.3 /100 | #186 | Fair $43,003 |
| Immigrants | Colombia | 31.5 /100 | #187 | Fair $42,971 |
| Immigrants | Africa | 31.0 /100 | #188 | Fair $42,950 |
Demographics Similar to Cheyenne by Per Capita Income
In terms of per capita income, the demographic groups most similar to Cheyenne are Kiowa ($35,102, a difference of 0.50%), Creek ($35,546, a difference of 0.76%), Black/African American ($35,564, a difference of 0.82%), Immigrants from Central America ($34,974, a difference of 0.87%), and Immigrants from Cuba ($34,910, a difference of 1.1%).
| Demographics | Rating | Rank | Per Capita Income |
| Choctaw | 0.0 /100 | #316 | Tragic $35,999 |
| Dutch West Indians | 0.0 /100 | #317 | Tragic $35,922 |
| Bangladeshis | 0.0 /100 | #318 | Tragic $35,897 |
| Immigrants | Congo | 0.0 /100 | #319 | Tragic $35,720 |
| Hispanics or Latinos | 0.0 /100 | #320 | Tragic $35,688 |
| Blacks/African Americans | 0.0 /100 | #321 | Tragic $35,564 |
| Creek | 0.0 /100 | #322 | Tragic $35,546 |
| Cheyenne | 0.0 /100 | #323 | Tragic $35,276 |
| Kiowa | 0.0 /100 | #324 | Tragic $35,102 |
| Immigrants | Central America | 0.0 /100 | #325 | Tragic $34,974 |
| Immigrants | Cuba | 0.0 /100 | #326 | Tragic $34,910 |
| Apache | 0.0 /100 | #327 | Tragic $34,886 |
| Menominee | 0.0 /100 | #328 | Tragic $34,578 |
| Mexicans | 0.0 /100 | #329 | Tragic $34,559 |
| Spanish American Indians | 0.0 /100 | #330 | Tragic $34,195 |