Welsh vs Immigrants from Somalia Disability Age Under 5
COMPARE
Welsh
Immigrants from Somalia
Disability Age Under 5
Disability Age Under 5 Comparison
Welsh
Immigrants from Somalia
1.6%
DISABILITY AGE UNDER 5
0.0/ 100
METRIC RATING
302nd/ 347
METRIC RANK
1.3%
DISABILITY AGE UNDER 5
31.3/ 100
METRIC RATING
197th/ 347
METRIC RANK
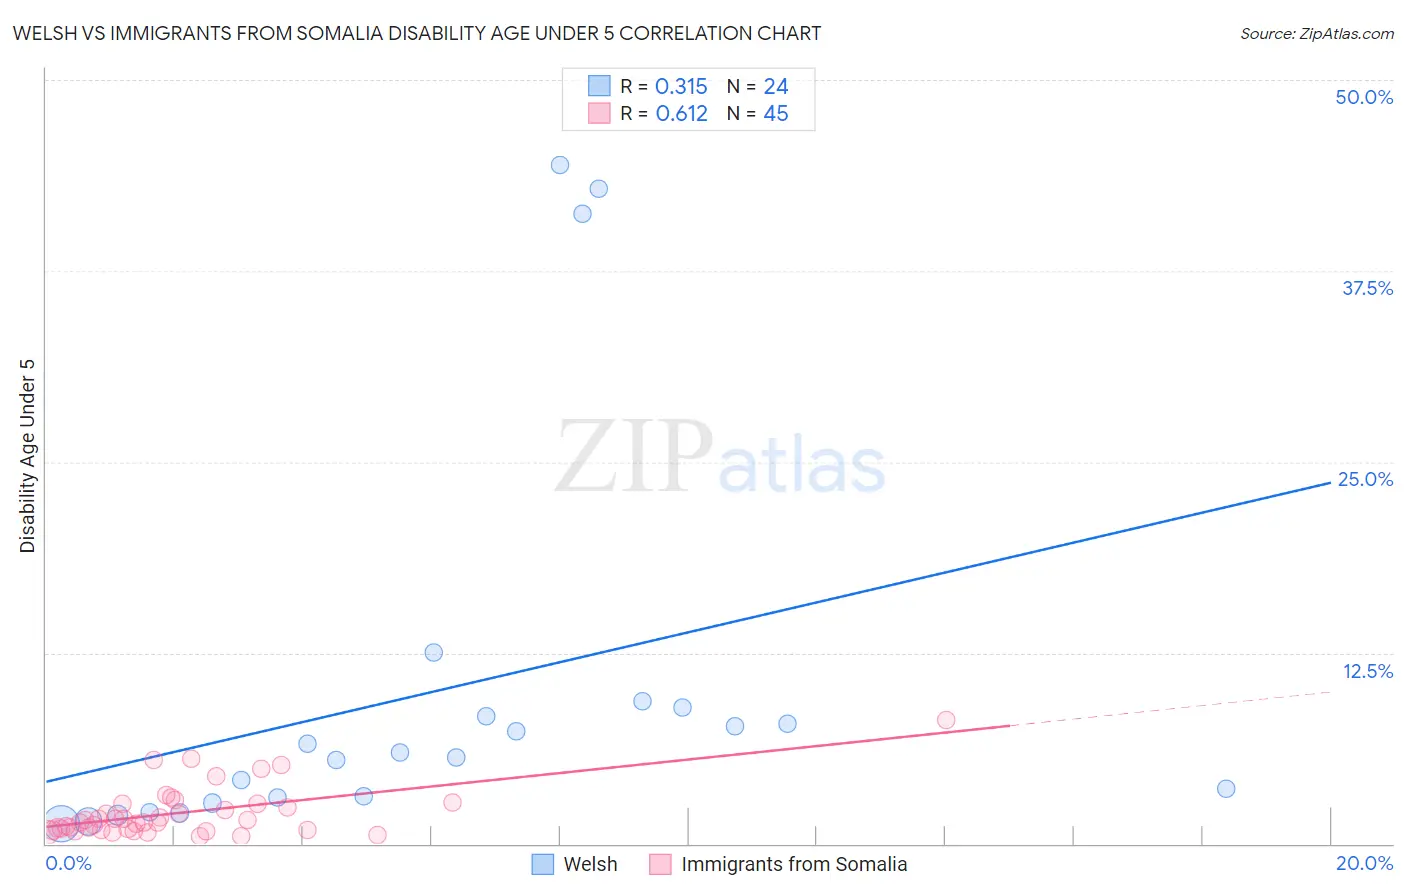
Welsh vs Immigrants from Somalia Disability Age Under 5 Correlation Chart
The statistical analysis conducted on geographies consisting of 248,340,053 people shows a mild positive correlation between the proportion of Welsh and percentage of population with a disability under the age of 5 in the United States with a correlation coefficient (R) of 0.315 and weighted average of 1.6%. Similarly, the statistical analysis conducted on geographies consisting of 75,075,754 people shows a significant positive correlation between the proportion of Immigrants from Somalia and percentage of population with a disability under the age of 5 in the United States with a correlation coefficient (R) of 0.612 and weighted average of 1.3%, a difference of 29.1%.
Disability Age Under 5 Correlation Summary
| Measurement | Welsh | Immigrants from Somalia |
| Minimum | 1.3% | 0.47% |
| Maximum | 44.4% | 8.1% |
| Range | 43.1% | 7.7% |
| Mean | 10.0% | 2.0% |
| Median | 5.8% | 1.4% |
| Interquartile 25% (IQ1) | 2.8% | 0.90% |
| Interquartile 75% (IQ3) | 8.6% | 2.6% |
| Interquartile Range (IQR) | 5.8% | 1.7% |
| Standard Deviation (Sample) | 13.0% | 1.6% |
| Standard Deviation (Population) | 12.8% | 1.6% |
Similar Demographics by Disability Age Under 5
Demographics Similar to Welsh by Disability Age Under 5
In terms of disability age under 5, the demographic groups most similar to Welsh are German Russian (1.6%, a difference of 0.12%), Swiss (1.6%, a difference of 0.16%), Shoshone (1.6%, a difference of 0.56%), Seminole (1.6%, a difference of 0.79%), and Portuguese (1.6%, a difference of 0.89%).
| Demographics | Rating | Rank | Disability Age Under 5 |
| Finns | 0.0 /100 | #295 | Tragic 1.6% |
| Poles | 0.0 /100 | #296 | Tragic 1.6% |
| Immigrants | Nonimmigrants | 0.0 /100 | #297 | Tragic 1.6% |
| Cajuns | 0.0 /100 | #298 | Tragic 1.6% |
| Portuguese | 0.0 /100 | #299 | Tragic 1.6% |
| Shoshone | 0.0 /100 | #300 | Tragic 1.6% |
| German Russians | 0.0 /100 | #301 | Tragic 1.6% |
| Welsh | 0.0 /100 | #302 | Tragic 1.6% |
| Swiss | 0.0 /100 | #303 | Tragic 1.6% |
| Seminole | 0.0 /100 | #304 | Tragic 1.6% |
| Blackfeet | 0.0 /100 | #305 | Tragic 1.6% |
| Creek | 0.0 /100 | #306 | Tragic 1.6% |
| Scottish | 0.0 /100 | #307 | Tragic 1.6% |
| Navajo | 0.0 /100 | #308 | Tragic 1.6% |
| Cape Verdeans | 0.0 /100 | #309 | Tragic 1.7% |
Demographics Similar to Immigrants from Somalia by Disability Age Under 5
In terms of disability age under 5, the demographic groups most similar to Immigrants from Somalia are Immigrants from Belgium (1.3%, a difference of 0.010%), Immigrants from Norway (1.3%, a difference of 0.030%), Jamaican (1.3%, a difference of 0.070%), U.S. Virgin Islander (1.3%, a difference of 0.31%), and Immigrants from North Macedonia (1.3%, a difference of 0.34%).
| Demographics | Rating | Rank | Disability Age Under 5 |
| Immigrants | Laos | 36.6 /100 | #190 | Fair 1.3% |
| Mexican American Indians | 36.6 /100 | #191 | Fair 1.3% |
| Immigrants | Bosnia and Herzegovina | 36.5 /100 | #192 | Fair 1.3% |
| Immigrants | Sierra Leone | 36.5 /100 | #193 | Fair 1.3% |
| Immigrants | North Macedonia | 34.7 /100 | #194 | Fair 1.3% |
| U.S. Virgin Islanders | 34.4 /100 | #195 | Fair 1.3% |
| Immigrants | Belgium | 31.4 /100 | #196 | Fair 1.3% |
| Immigrants | Somalia | 31.3 /100 | #197 | Fair 1.3% |
| Immigrants | Norway | 31.1 /100 | #198 | Fair 1.3% |
| Jamaicans | 30.7 /100 | #199 | Fair 1.3% |
| Immigrants | Lithuania | 27.2 /100 | #200 | Fair 1.3% |
| Immigrants | Italy | 25.4 /100 | #201 | Fair 1.3% |
| Arapaho | 24.1 /100 | #202 | Fair 1.3% |
| Liberians | 24.0 /100 | #203 | Fair 1.3% |
| Immigrants | Europe | 23.6 /100 | #204 | Fair 1.3% |