Immigrants from South Central Asia vs Cheyenne Disability Age Under 5
COMPARE
Immigrants from South Central Asia
Cheyenne
Disability Age Under 5
Disability Age Under 5 Comparison
Immigrants from South Central Asia
Cheyenne
1.0%
DISABILITY AGE UNDER 5
99.9/ 100
METRIC RATING
30th/ 347
METRIC RANK
1.5%
DISABILITY AGE UNDER 5
0.0/ 100
METRIC RATING
282nd/ 347
METRIC RANK
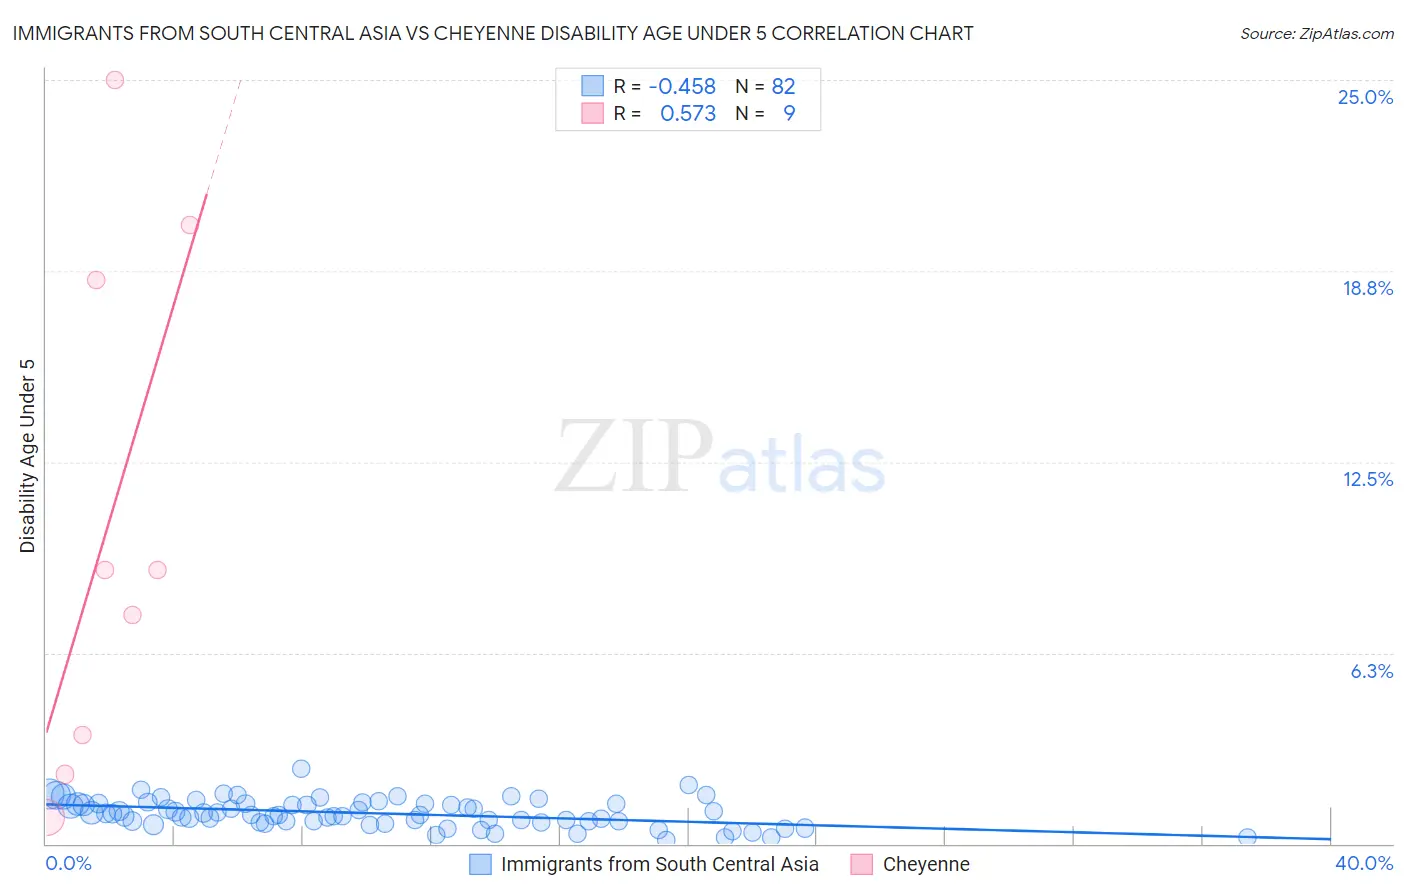
Immigrants from South Central Asia vs Cheyenne Disability Age Under 5 Correlation Chart
The statistical analysis conducted on geographies consisting of 240,701,404 people shows a moderate negative correlation between the proportion of Immigrants from South Central Asia and percentage of population with a disability under the age of 5 in the United States with a correlation coefficient (R) of -0.458 and weighted average of 1.0%. Similarly, the statistical analysis conducted on geographies consisting of 66,176,849 people shows a substantial positive correlation between the proportion of Cheyenne and percentage of population with a disability under the age of 5 in the United States with a correlation coefficient (R) of 0.573 and weighted average of 1.5%, a difference of 47.6%.
Disability Age Under 5 Correlation Summary
| Measurement | Immigrants from South Central Asia | Cheyenne |
| Minimum | 0.13% | 0.85% |
| Maximum | 2.5% | 25.0% |
| Range | 2.3% | 24.1% |
| Mean | 1.0% | 10.6% |
| Median | 0.97% | 9.0% |
| Interquartile 25% (IQ1) | 0.72% | 2.9% |
| Interquartile 75% (IQ3) | 1.3% | 19.4% |
| Interquartile Range (IQR) | 0.59% | 16.4% |
| Standard Deviation (Sample) | 0.45% | 8.6% |
| Standard Deviation (Population) | 0.44% | 8.1% |
Similar Demographics by Disability Age Under 5
Demographics Similar to Immigrants from South Central Asia by Disability Age Under 5
In terms of disability age under 5, the demographic groups most similar to Immigrants from South Central Asia are Armenian (1.0%, a difference of 0.28%), Iranian (1.0%, a difference of 0.33%), Bolivian (1.0%, a difference of 0.51%), Immigrants from Belarus (1.0%, a difference of 0.52%), and Immigrants from Ukraine (1.0%, a difference of 0.63%).
| Demographics | Rating | Rank | Disability Age Under 5 |
| Yakama | 100.0 /100 | #23 | Exceptional 1.00% |
| Indians (Asian) | 100.0 /100 | #24 | Exceptional 1.0% |
| Immigrants | Micronesia | 100.0 /100 | #25 | Exceptional 1.0% |
| Immigrants | Taiwan | 100.0 /100 | #26 | Exceptional 1.0% |
| Guyanese | 100.0 /100 | #27 | Exceptional 1.0% |
| Immigrants | Eastern Asia | 100.0 /100 | #28 | Exceptional 1.0% |
| Immigrants | Belarus | 100.0 /100 | #29 | Exceptional 1.0% |
| Immigrants | South Central Asia | 99.9 /100 | #30 | Exceptional 1.0% |
| Armenians | 99.9 /100 | #31 | Exceptional 1.0% |
| Iranians | 99.9 /100 | #32 | Exceptional 1.0% |
| Bolivians | 99.9 /100 | #33 | Exceptional 1.0% |
| Immigrants | Ukraine | 99.9 /100 | #34 | Exceptional 1.0% |
| Barbadians | 99.9 /100 | #35 | Exceptional 1.0% |
| Immigrants | Nepal | 99.9 /100 | #36 | Exceptional 1.0% |
| Immigrants | India | 99.9 /100 | #37 | Exceptional 1.0% |
Demographics Similar to Cheyenne by Disability Age Under 5
In terms of disability age under 5, the demographic groups most similar to Cheyenne are Delaware (1.5%, a difference of 0.19%), European (1.5%, a difference of 0.25%), Czechoslovakian (1.5%, a difference of 0.34%), Croatian (1.5%, a difference of 1.4%), and Tlingit-Haida (1.5%, a difference of 1.7%).
| Demographics | Rating | Rank | Disability Age Under 5 |
| Brazilians | 0.0 /100 | #275 | Tragic 1.5% |
| Greeks | 0.0 /100 | #276 | Tragic 1.5% |
| Canadians | 0.0 /100 | #277 | Tragic 1.5% |
| Kiowa | 0.0 /100 | #278 | Tragic 1.5% |
| Danes | 0.0 /100 | #279 | Tragic 1.5% |
| British | 0.0 /100 | #280 | Tragic 1.5% |
| Czechoslovakians | 0.0 /100 | #281 | Tragic 1.5% |
| Cheyenne | 0.0 /100 | #282 | Tragic 1.5% |
| Delaware | 0.0 /100 | #283 | Tragic 1.5% |
| Europeans | 0.0 /100 | #284 | Tragic 1.5% |
| Croatians | 0.0 /100 | #285 | Tragic 1.5% |
| Tlingit-Haida | 0.0 /100 | #286 | Tragic 1.5% |
| Scandinavians | 0.0 /100 | #287 | Tragic 1.5% |
| Estonians | 0.0 /100 | #288 | Tragic 1.5% |
| Hungarians | 0.0 /100 | #289 | Tragic 1.5% |