Yup'ik vs Cheyenne Disability Age Under 5
COMPARE
Yup'ik
Cheyenne
Disability Age Under 5
Disability Age Under 5 Comparison
Yup'ik
Cheyenne
4.5%
DISABILITY AGE UNDER 5
0.0/ 100
METRIC RATING
346th/ 347
METRIC RANK
1.5%
DISABILITY AGE UNDER 5
0.0/ 100
METRIC RATING
282nd/ 347
METRIC RANK
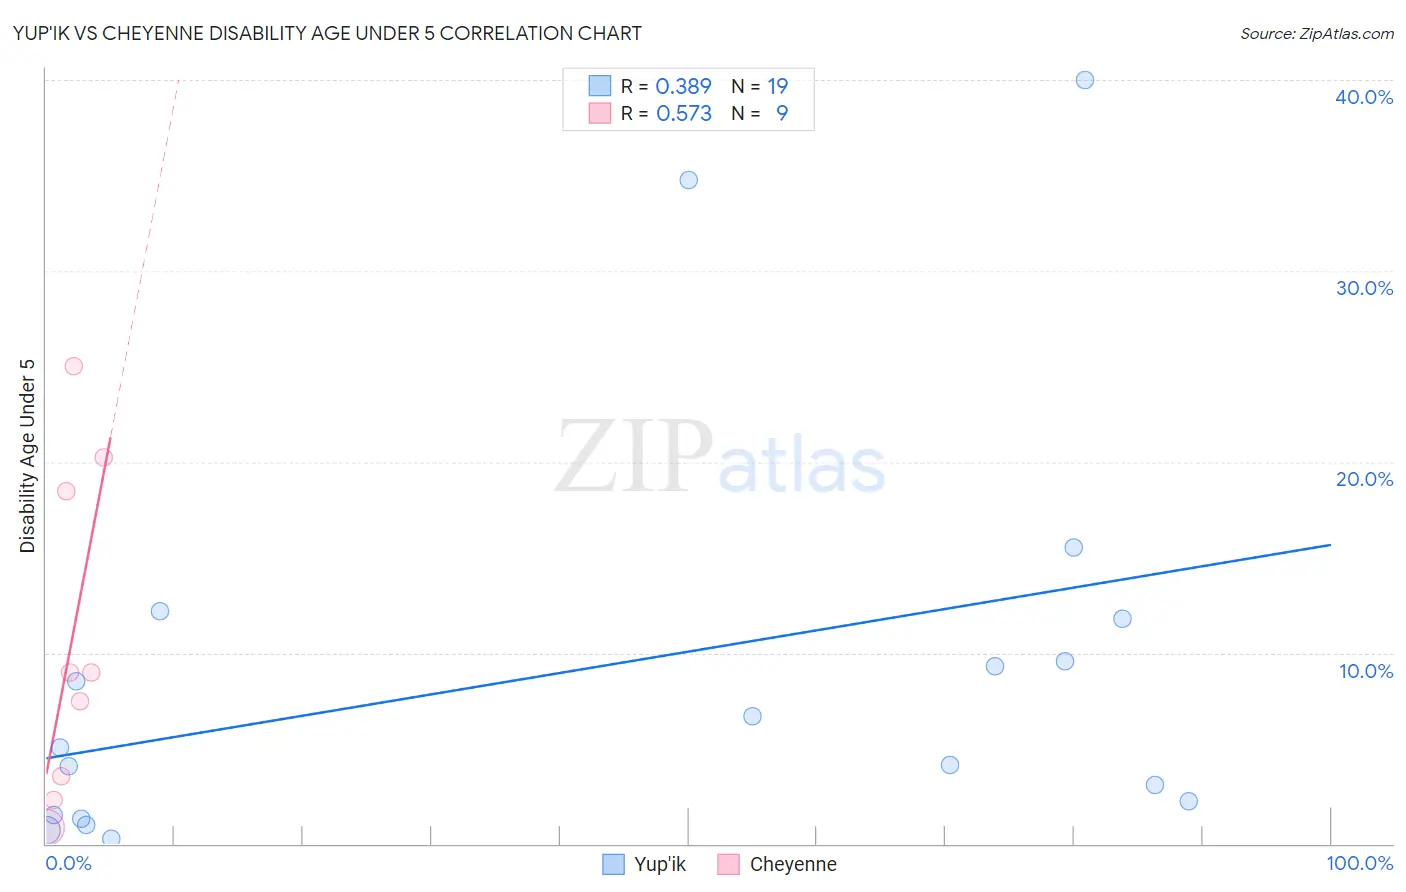
Yup'ik vs Cheyenne Disability Age Under 5 Correlation Chart
The statistical analysis conducted on geographies consisting of 34,357,684 people shows a mild positive correlation between the proportion of Yup'ik and percentage of population with a disability under the age of 5 in the United States with a correlation coefficient (R) of 0.389 and weighted average of 4.5%. Similarly, the statistical analysis conducted on geographies consisting of 66,176,849 people shows a substantial positive correlation between the proportion of Cheyenne and percentage of population with a disability under the age of 5 in the United States with a correlation coefficient (R) of 0.573 and weighted average of 1.5%, a difference of 198.3%.
Disability Age Under 5 Correlation Summary
| Measurement | Yup'ik | Cheyenne |
| Minimum | 0.26% | 0.85% |
| Maximum | 40.0% | 25.0% |
| Range | 39.7% | 24.1% |
| Mean | 9.0% | 10.6% |
| Median | 5.1% | 9.0% |
| Interquartile 25% (IQ1) | 1.5% | 2.9% |
| Interquartile 75% (IQ3) | 11.8% | 19.4% |
| Interquartile Range (IQR) | 10.2% | 16.4% |
| Standard Deviation (Sample) | 11.0% | 8.6% |
| Standard Deviation (Population) | 10.7% | 8.1% |
Similar Demographics by Disability Age Under 5
Demographics Similar to Yup'ik by Disability Age Under 5
In terms of disability age under 5, the demographic groups most similar to Yup'ik are Hopi (4.6%, a difference of 2.3%), Paiute (3.9%, a difference of 15.8%), Inupiat (3.7%, a difference of 22.0%), Colville (3.3%, a difference of 37.8%), and Alaska Native (2.9%, a difference of 53.8%).
| Demographics | Rating | Rank | Disability Age Under 5 |
| Dutch West Indians | 0.0 /100 | #333 | Tragic 1.9% |
| Natives/Alaskans | 0.0 /100 | #334 | Tragic 1.9% |
| Pennsylvania Germans | 0.0 /100 | #335 | Tragic 1.9% |
| Paraguayans | 0.0 /100 | #336 | Tragic 2.0% |
| Apache | 0.0 /100 | #337 | Tragic 2.0% |
| Tohono O'odham | 0.0 /100 | #338 | Tragic 2.2% |
| Immigrants | Azores | 0.0 /100 | #339 | Tragic 2.2% |
| Menominee | 0.0 /100 | #340 | Tragic 2.3% |
| Tsimshian | 0.0 /100 | #341 | Tragic 2.4% |
| Alaska Natives | 0.0 /100 | #342 | Tragic 2.9% |
| Colville | 0.0 /100 | #343 | Tragic 3.3% |
| Inupiat | 0.0 /100 | #344 | Tragic 3.7% |
| Paiute | 0.0 /100 | #345 | Tragic 3.9% |
| Yup'ik | 0.0 /100 | #346 | Tragic 4.5% |
| Hopi | 0.0 /100 | #347 | Tragic 4.6% |
Demographics Similar to Cheyenne by Disability Age Under 5
In terms of disability age under 5, the demographic groups most similar to Cheyenne are Delaware (1.5%, a difference of 0.19%), European (1.5%, a difference of 0.25%), Czechoslovakian (1.5%, a difference of 0.34%), Croatian (1.5%, a difference of 1.4%), and Tlingit-Haida (1.5%, a difference of 1.7%).
| Demographics | Rating | Rank | Disability Age Under 5 |
| Brazilians | 0.0 /100 | #275 | Tragic 1.5% |
| Greeks | 0.0 /100 | #276 | Tragic 1.5% |
| Canadians | 0.0 /100 | #277 | Tragic 1.5% |
| Kiowa | 0.0 /100 | #278 | Tragic 1.5% |
| Danes | 0.0 /100 | #279 | Tragic 1.5% |
| British | 0.0 /100 | #280 | Tragic 1.5% |
| Czechoslovakians | 0.0 /100 | #281 | Tragic 1.5% |
| Cheyenne | 0.0 /100 | #282 | Tragic 1.5% |
| Delaware | 0.0 /100 | #283 | Tragic 1.5% |
| Europeans | 0.0 /100 | #284 | Tragic 1.5% |
| Croatians | 0.0 /100 | #285 | Tragic 1.5% |
| Tlingit-Haida | 0.0 /100 | #286 | Tragic 1.5% |
| Scandinavians | 0.0 /100 | #287 | Tragic 1.5% |
| Estonians | 0.0 /100 | #288 | Tragic 1.5% |
| Hungarians | 0.0 /100 | #289 | Tragic 1.5% |