Welsh vs Immigrants from Ecuador Disability Age Under 5
COMPARE
Welsh
Immigrants from Ecuador
Disability Age Under 5
Disability Age Under 5 Comparison
Welsh
Immigrants from Ecuador
1.6%
DISABILITY AGE UNDER 5
0.0/ 100
METRIC RATING
302nd/ 347
METRIC RANK
1.1%
DISABILITY AGE UNDER 5
98.6/ 100
METRIC RATING
70th/ 347
METRIC RANK
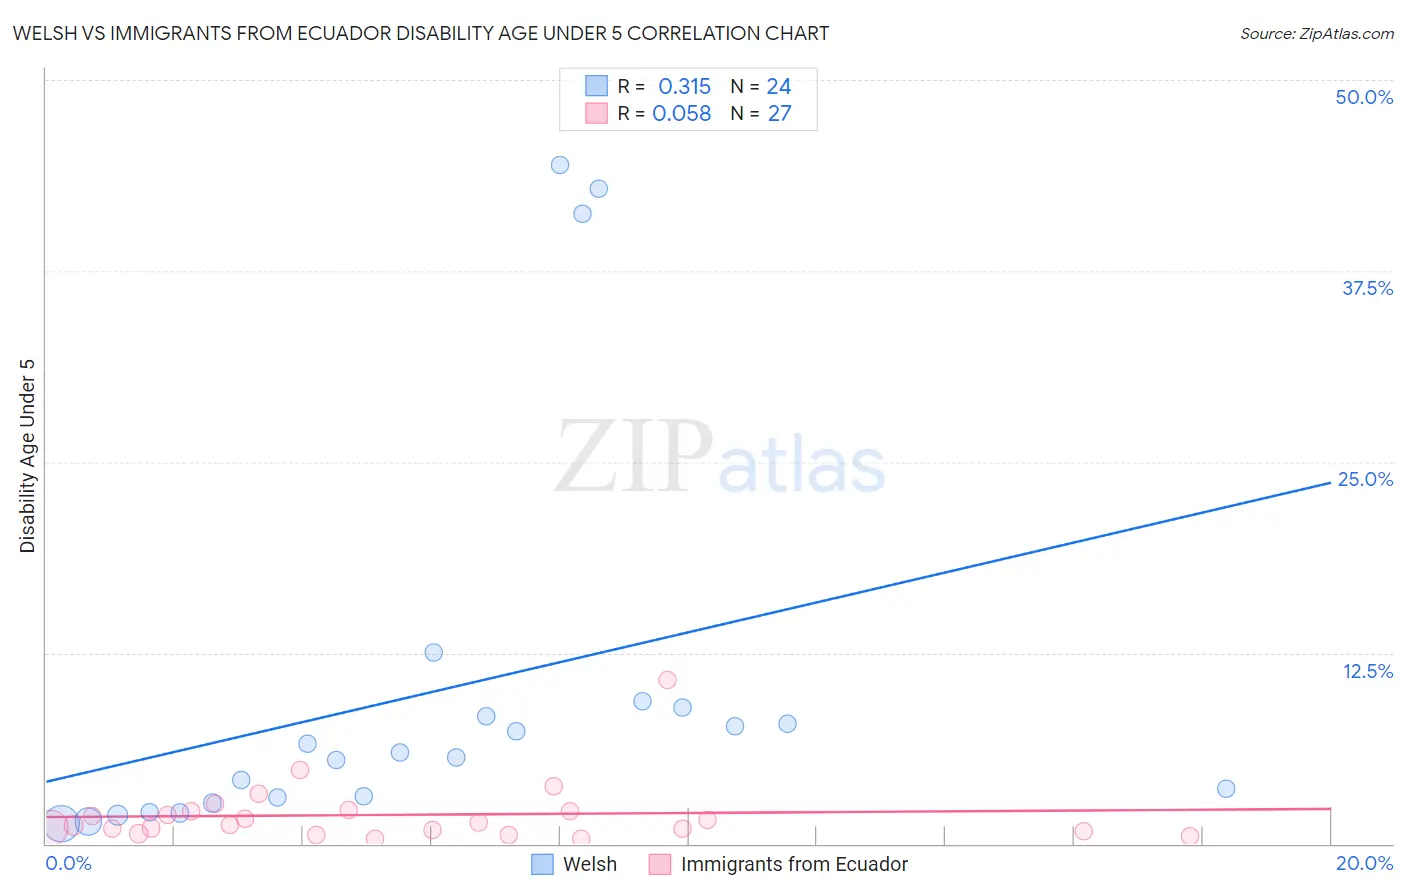
Welsh vs Immigrants from Ecuador Disability Age Under 5 Correlation Chart
The statistical analysis conducted on geographies consisting of 248,340,053 people shows a mild positive correlation between the proportion of Welsh and percentage of population with a disability under the age of 5 in the United States with a correlation coefficient (R) of 0.315 and weighted average of 1.6%. Similarly, the statistical analysis conducted on geographies consisting of 164,756,181 people shows a slight positive correlation between the proportion of Immigrants from Ecuador and percentage of population with a disability under the age of 5 in the United States with a correlation coefficient (R) of 0.058 and weighted average of 1.1%, a difference of 45.5%.
Disability Age Under 5 Correlation Summary
| Measurement | Welsh | Immigrants from Ecuador |
| Minimum | 1.3% | 0.33% |
| Maximum | 44.4% | 10.7% |
| Range | 43.1% | 10.4% |
| Mean | 10.0% | 1.9% |
| Median | 5.8% | 1.2% |
| Interquartile 25% (IQ1) | 2.8% | 0.82% |
| Interquartile 75% (IQ3) | 8.6% | 2.2% |
| Interquartile Range (IQR) | 5.8% | 1.3% |
| Standard Deviation (Sample) | 13.0% | 2.1% |
| Standard Deviation (Population) | 12.8% | 2.0% |
Similar Demographics by Disability Age Under 5
Demographics Similar to Welsh by Disability Age Under 5
In terms of disability age under 5, the demographic groups most similar to Welsh are German Russian (1.6%, a difference of 0.12%), Swiss (1.6%, a difference of 0.16%), Shoshone (1.6%, a difference of 0.56%), Seminole (1.6%, a difference of 0.79%), and Portuguese (1.6%, a difference of 0.89%).
| Demographics | Rating | Rank | Disability Age Under 5 |
| Finns | 0.0 /100 | #295 | Tragic 1.6% |
| Poles | 0.0 /100 | #296 | Tragic 1.6% |
| Immigrants | Nonimmigrants | 0.0 /100 | #297 | Tragic 1.6% |
| Cajuns | 0.0 /100 | #298 | Tragic 1.6% |
| Portuguese | 0.0 /100 | #299 | Tragic 1.6% |
| Shoshone | 0.0 /100 | #300 | Tragic 1.6% |
| German Russians | 0.0 /100 | #301 | Tragic 1.6% |
| Welsh | 0.0 /100 | #302 | Tragic 1.6% |
| Swiss | 0.0 /100 | #303 | Tragic 1.6% |
| Seminole | 0.0 /100 | #304 | Tragic 1.6% |
| Blackfeet | 0.0 /100 | #305 | Tragic 1.6% |
| Creek | 0.0 /100 | #306 | Tragic 1.6% |
| Scottish | 0.0 /100 | #307 | Tragic 1.6% |
| Navajo | 0.0 /100 | #308 | Tragic 1.6% |
| Cape Verdeans | 0.0 /100 | #309 | Tragic 1.7% |
Demographics Similar to Immigrants from Ecuador by Disability Age Under 5
In terms of disability age under 5, the demographic groups most similar to Immigrants from Ecuador are Trinidadian and Tobagonian (1.1%, a difference of 0.060%), Israeli (1.1%, a difference of 0.090%), South African (1.1%, a difference of 0.11%), Immigrants from Belize (1.1%, a difference of 0.15%), and Immigrants from Indonesia (1.1%, a difference of 0.22%).
| Demographics | Rating | Rank | Disability Age Under 5 |
| Immigrants | Vietnam | 99.1 /100 | #63 | Exceptional 1.1% |
| Egyptians | 98.9 /100 | #64 | Exceptional 1.1% |
| Immigrants | Korea | 98.8 /100 | #65 | Exceptional 1.1% |
| Immigrants | Indonesia | 98.7 /100 | #66 | Exceptional 1.1% |
| Immigrants | Belize | 98.7 /100 | #67 | Exceptional 1.1% |
| South Africans | 98.7 /100 | #68 | Exceptional 1.1% |
| Israelis | 98.7 /100 | #69 | Exceptional 1.1% |
| Immigrants | Ecuador | 98.6 /100 | #70 | Exceptional 1.1% |
| Trinidadians and Tobagonians | 98.6 /100 | #71 | Exceptional 1.1% |
| Burmese | 98.5 /100 | #72 | Exceptional 1.1% |
| Immigrants | Sri Lanka | 98.5 /100 | #73 | Exceptional 1.1% |
| Jordanians | 98.5 /100 | #74 | Exceptional 1.1% |
| Immigrants | Pakistan | 98.4 /100 | #75 | Exceptional 1.1% |
| Immigrants | Burma/Myanmar | 98.2 /100 | #76 | Exceptional 1.1% |
| Immigrants | Denmark | 98.1 /100 | #77 | Exceptional 1.1% |