Immigrants from Sri Lanka vs Cheyenne Disability Age Under 5
COMPARE
Immigrants from Sri Lanka
Cheyenne
Disability Age Under 5
Disability Age Under 5 Comparison
Immigrants from Sri Lanka
Cheyenne
1.1%
DISABILITY AGE UNDER 5
98.5/ 100
METRIC RATING
73rd/ 347
METRIC RANK
1.5%
DISABILITY AGE UNDER 5
0.0/ 100
METRIC RATING
282nd/ 347
METRIC RANK
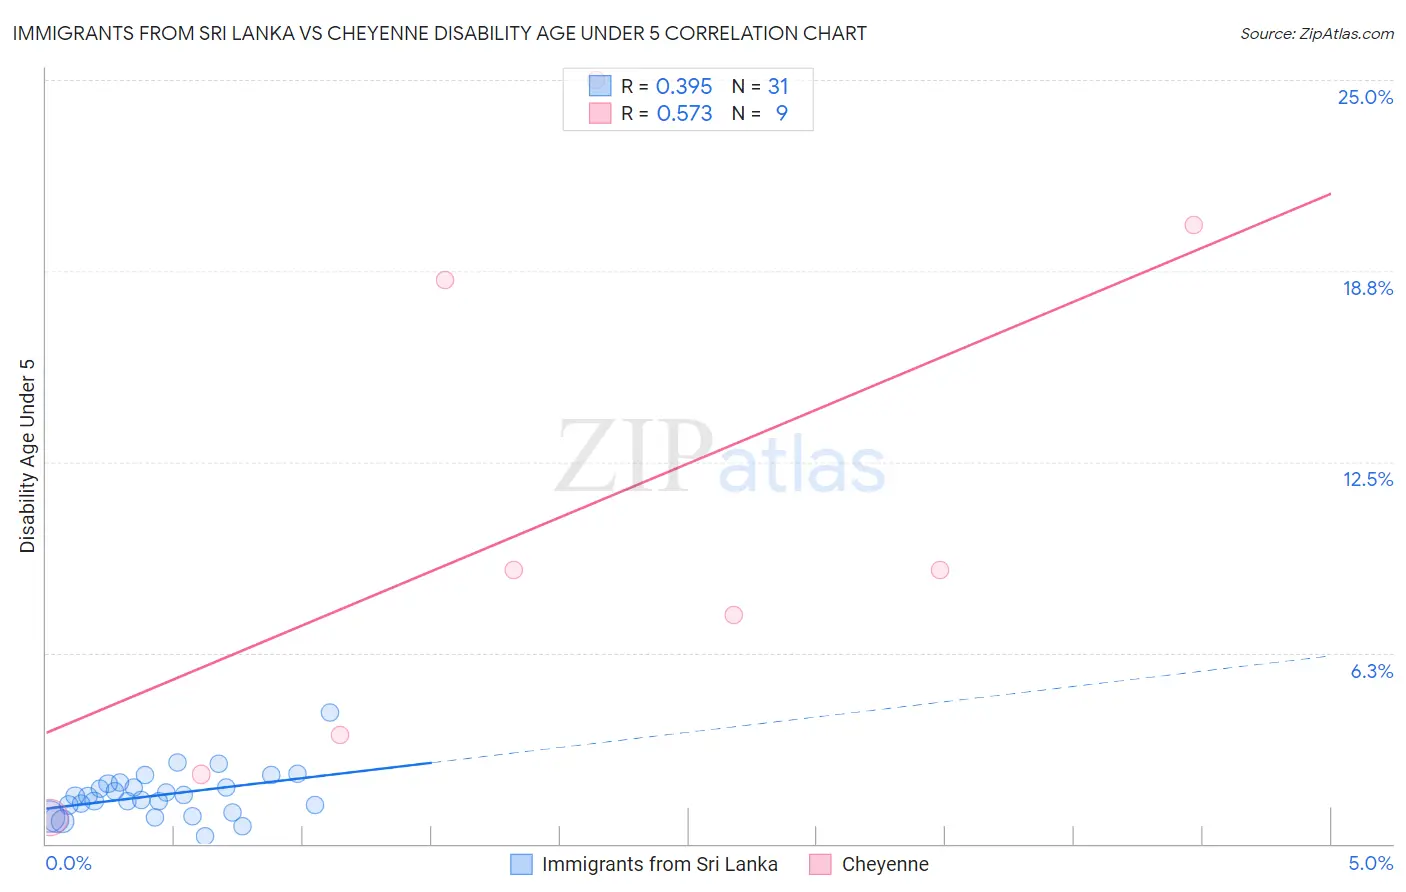
Immigrants from Sri Lanka vs Cheyenne Disability Age Under 5 Correlation Chart
The statistical analysis conducted on geographies consisting of 104,720,204 people shows a mild positive correlation between the proportion of Immigrants from Sri Lanka and percentage of population with a disability under the age of 5 in the United States with a correlation coefficient (R) of 0.395 and weighted average of 1.1%. Similarly, the statistical analysis conducted on geographies consisting of 66,176,849 people shows a substantial positive correlation between the proportion of Cheyenne and percentage of population with a disability under the age of 5 in the United States with a correlation coefficient (R) of 0.573 and weighted average of 1.5%, a difference of 35.0%.
Disability Age Under 5 Correlation Summary
| Measurement | Immigrants from Sri Lanka | Cheyenne |
| Minimum | 0.25% | 0.85% |
| Maximum | 4.3% | 25.0% |
| Range | 4.0% | 24.1% |
| Mean | 1.6% | 10.6% |
| Median | 1.6% | 9.0% |
| Interquartile 25% (IQ1) | 1.0% | 2.9% |
| Interquartile 75% (IQ3) | 2.0% | 19.4% |
| Interquartile Range (IQR) | 0.97% | 16.4% |
| Standard Deviation (Sample) | 0.77% | 8.6% |
| Standard Deviation (Population) | 0.76% | 8.1% |
Similar Demographics by Disability Age Under 5
Demographics Similar to Immigrants from Sri Lanka by Disability Age Under 5
In terms of disability age under 5, the demographic groups most similar to Immigrants from Sri Lanka are Jordanian (1.1%, a difference of 0.0%), Burmese (1.1%, a difference of 0.080%), Immigrants from Pakistan (1.1%, a difference of 0.090%), Trinidadian and Tobagonian (1.1%, a difference of 0.24%), and Immigrants from Ecuador (1.1%, a difference of 0.30%).
| Demographics | Rating | Rank | Disability Age Under 5 |
| Immigrants | Indonesia | 98.7 /100 | #66 | Exceptional 1.1% |
| Immigrants | Belize | 98.7 /100 | #67 | Exceptional 1.1% |
| South Africans | 98.7 /100 | #68 | Exceptional 1.1% |
| Israelis | 98.7 /100 | #69 | Exceptional 1.1% |
| Immigrants | Ecuador | 98.6 /100 | #70 | Exceptional 1.1% |
| Trinidadians and Tobagonians | 98.6 /100 | #71 | Exceptional 1.1% |
| Burmese | 98.5 /100 | #72 | Exceptional 1.1% |
| Immigrants | Sri Lanka | 98.5 /100 | #73 | Exceptional 1.1% |
| Jordanians | 98.5 /100 | #74 | Exceptional 1.1% |
| Immigrants | Pakistan | 98.4 /100 | #75 | Exceptional 1.1% |
| Immigrants | Burma/Myanmar | 98.2 /100 | #76 | Exceptional 1.1% |
| Immigrants | Denmark | 98.1 /100 | #77 | Exceptional 1.1% |
| West Indians | 98.0 /100 | #78 | Exceptional 1.1% |
| Hmong | 98.0 /100 | #79 | Exceptional 1.1% |
| Immigrants | Trinidad and Tobago | 98.0 /100 | #80 | Exceptional 1.1% |
Demographics Similar to Cheyenne by Disability Age Under 5
In terms of disability age under 5, the demographic groups most similar to Cheyenne are Delaware (1.5%, a difference of 0.19%), European (1.5%, a difference of 0.25%), Czechoslovakian (1.5%, a difference of 0.34%), Croatian (1.5%, a difference of 1.4%), and Tlingit-Haida (1.5%, a difference of 1.7%).
| Demographics | Rating | Rank | Disability Age Under 5 |
| Brazilians | 0.0 /100 | #275 | Tragic 1.5% |
| Greeks | 0.0 /100 | #276 | Tragic 1.5% |
| Canadians | 0.0 /100 | #277 | Tragic 1.5% |
| Kiowa | 0.0 /100 | #278 | Tragic 1.5% |
| Danes | 0.0 /100 | #279 | Tragic 1.5% |
| British | 0.0 /100 | #280 | Tragic 1.5% |
| Czechoslovakians | 0.0 /100 | #281 | Tragic 1.5% |
| Cheyenne | 0.0 /100 | #282 | Tragic 1.5% |
| Delaware | 0.0 /100 | #283 | Tragic 1.5% |
| Europeans | 0.0 /100 | #284 | Tragic 1.5% |
| Croatians | 0.0 /100 | #285 | Tragic 1.5% |
| Tlingit-Haida | 0.0 /100 | #286 | Tragic 1.5% |
| Scandinavians | 0.0 /100 | #287 | Tragic 1.5% |
| Estonians | 0.0 /100 | #288 | Tragic 1.5% |
| Hungarians | 0.0 /100 | #289 | Tragic 1.5% |