Immigrants from Caribbean vs Cheyenne Disability Age Under 5
COMPARE
Immigrants from Caribbean
Cheyenne
Disability Age Under 5
Disability Age Under 5 Comparison
Immigrants from Caribbean
Cheyenne
1.2%
DISABILITY AGE UNDER 5
93.8/ 100
METRIC RATING
115th/ 347
METRIC RANK
1.5%
DISABILITY AGE UNDER 5
0.0/ 100
METRIC RATING
282nd/ 347
METRIC RANK
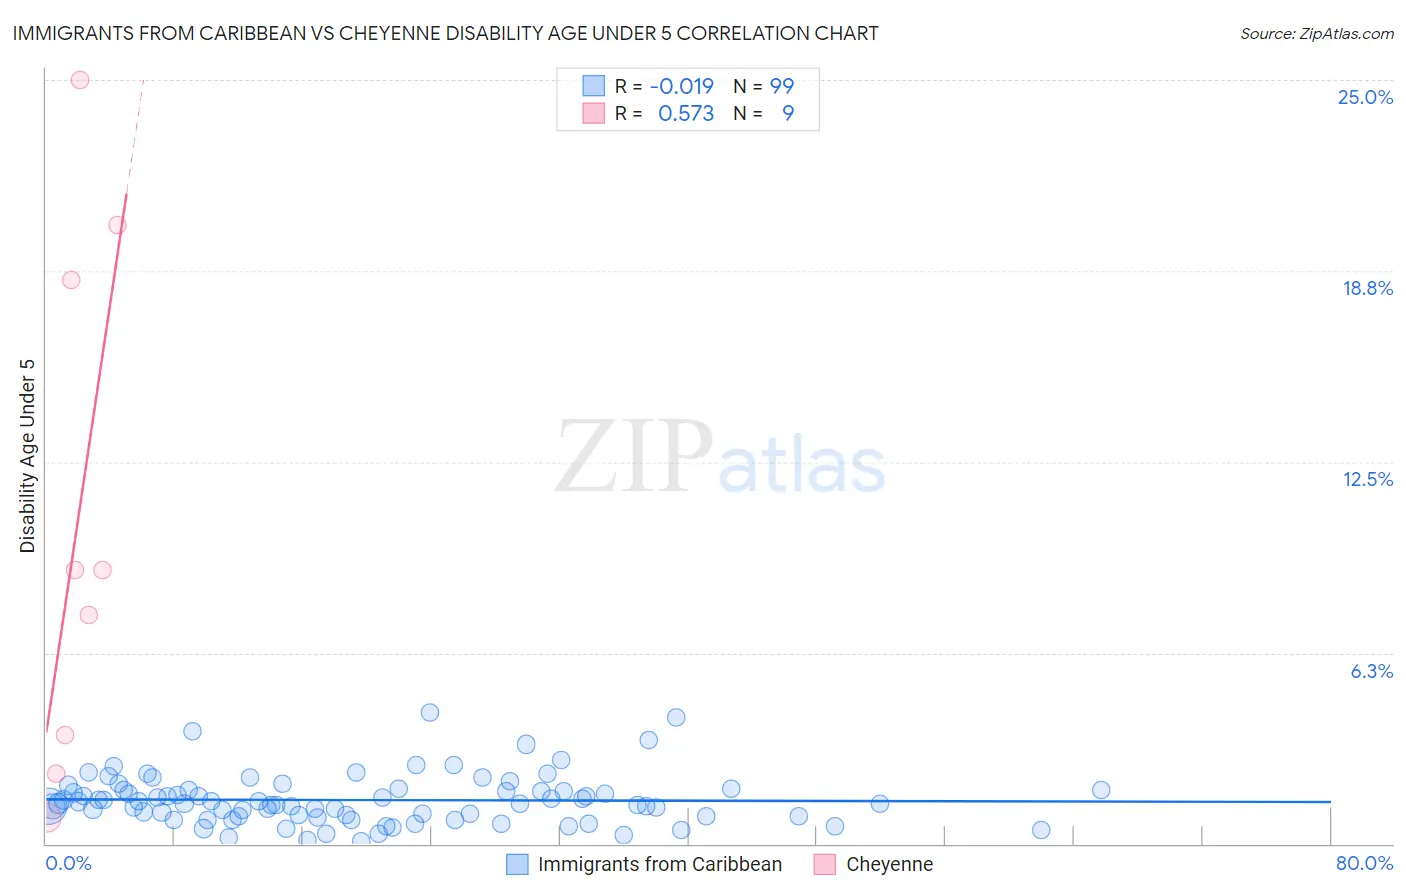
Immigrants from Caribbean vs Cheyenne Disability Age Under 5 Correlation Chart
The statistical analysis conducted on geographies consisting of 233,002,612 people shows no correlation between the proportion of Immigrants from Caribbean and percentage of population with a disability under the age of 5 in the United States with a correlation coefficient (R) of -0.019 and weighted average of 1.2%. Similarly, the statistical analysis conducted on geographies consisting of 66,176,849 people shows a substantial positive correlation between the proportion of Cheyenne and percentage of population with a disability under the age of 5 in the United States with a correlation coefficient (R) of 0.573 and weighted average of 1.5%, a difference of 30.4%.
Disability Age Under 5 Correlation Summary
| Measurement | Immigrants from Caribbean | Cheyenne |
| Minimum | 0.090% | 0.85% |
| Maximum | 4.3% | 25.0% |
| Range | 4.2% | 24.1% |
| Mean | 1.4% | 10.6% |
| Median | 1.3% | 9.0% |
| Interquartile 25% (IQ1) | 0.88% | 2.9% |
| Interquartile 75% (IQ3) | 1.8% | 19.4% |
| Interquartile Range (IQR) | 0.88% | 16.4% |
| Standard Deviation (Sample) | 0.81% | 8.6% |
| Standard Deviation (Population) | 0.80% | 8.1% |
Similar Demographics by Disability Age Under 5
Demographics Similar to Immigrants from Caribbean by Disability Age Under 5
In terms of disability age under 5, the demographic groups most similar to Immigrants from Caribbean are Belizean (1.2%, a difference of 0.010%), Immigrants from Northern Africa (1.2%, a difference of 0.020%), Immigrants from Philippines (1.2%, a difference of 0.15%), Immigrants from Oceania (1.2%, a difference of 0.16%), and Immigrants from Venezuela (1.2%, a difference of 0.19%).
| Demographics | Rating | Rank | Disability Age Under 5 |
| Iraqis | 95.1 /100 | #108 | Exceptional 1.2% |
| Immigrants | Panama | 95.0 /100 | #109 | Exceptional 1.2% |
| Immigrants | Lebanon | 95.0 /100 | #110 | Exceptional 1.2% |
| Senegalese | 94.6 /100 | #111 | Exceptional 1.2% |
| Immigrants | Australia | 94.4 /100 | #112 | Exceptional 1.2% |
| Immigrants | Oceania | 94.2 /100 | #113 | Exceptional 1.2% |
| Belizeans | 93.9 /100 | #114 | Exceptional 1.2% |
| Immigrants | Caribbean | 93.8 /100 | #115 | Exceptional 1.2% |
| Immigrants | Northern Africa | 93.8 /100 | #116 | Exceptional 1.2% |
| Immigrants | Philippines | 93.5 /100 | #117 | Exceptional 1.2% |
| Immigrants | Venezuela | 93.4 /100 | #118 | Exceptional 1.2% |
| Bhutanese | 92.5 /100 | #119 | Exceptional 1.2% |
| Immigrants | Eritrea | 92.3 /100 | #120 | Exceptional 1.2% |
| Immigrants | Senegal | 91.4 /100 | #121 | Exceptional 1.2% |
| Aleuts | 90.7 /100 | #122 | Exceptional 1.2% |
Demographics Similar to Cheyenne by Disability Age Under 5
In terms of disability age under 5, the demographic groups most similar to Cheyenne are Delaware (1.5%, a difference of 0.19%), European (1.5%, a difference of 0.25%), Czechoslovakian (1.5%, a difference of 0.34%), Croatian (1.5%, a difference of 1.4%), and Tlingit-Haida (1.5%, a difference of 1.7%).
| Demographics | Rating | Rank | Disability Age Under 5 |
| Brazilians | 0.0 /100 | #275 | Tragic 1.5% |
| Greeks | 0.0 /100 | #276 | Tragic 1.5% |
| Canadians | 0.0 /100 | #277 | Tragic 1.5% |
| Kiowa | 0.0 /100 | #278 | Tragic 1.5% |
| Danes | 0.0 /100 | #279 | Tragic 1.5% |
| British | 0.0 /100 | #280 | Tragic 1.5% |
| Czechoslovakians | 0.0 /100 | #281 | Tragic 1.5% |
| Cheyenne | 0.0 /100 | #282 | Tragic 1.5% |
| Delaware | 0.0 /100 | #283 | Tragic 1.5% |
| Europeans | 0.0 /100 | #284 | Tragic 1.5% |
| Croatians | 0.0 /100 | #285 | Tragic 1.5% |
| Tlingit-Haida | 0.0 /100 | #286 | Tragic 1.5% |
| Scandinavians | 0.0 /100 | #287 | Tragic 1.5% |
| Estonians | 0.0 /100 | #288 | Tragic 1.5% |
| Hungarians | 0.0 /100 | #289 | Tragic 1.5% |