Immigrants from Jordan vs Cheyenne Disability Age Under 5
COMPARE
Immigrants from Jordan
Cheyenne
Disability Age Under 5
Disability Age Under 5 Comparison
Immigrants from Jordan
Cheyenne
1.1%
DISABILITY AGE UNDER 5
97.9/ 100
METRIC RATING
82nd/ 347
METRIC RANK
1.5%
DISABILITY AGE UNDER 5
0.0/ 100
METRIC RATING
282nd/ 347
METRIC RANK
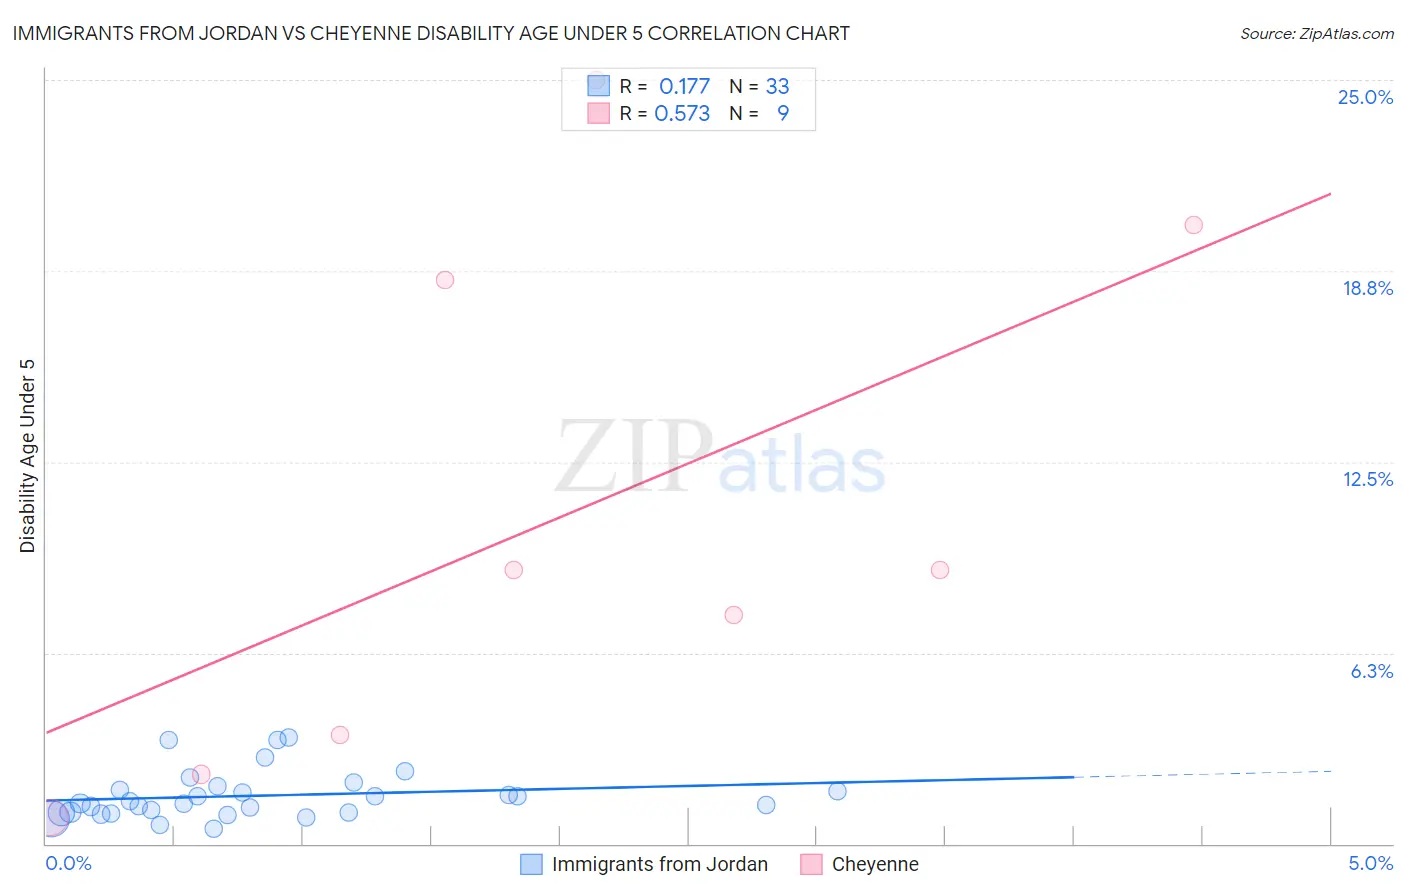
Immigrants from Jordan vs Cheyenne Disability Age Under 5 Correlation Chart
The statistical analysis conducted on geographies consisting of 123,224,652 people shows a poor positive correlation between the proportion of Immigrants from Jordan and percentage of population with a disability under the age of 5 in the United States with a correlation coefficient (R) of 0.177 and weighted average of 1.1%. Similarly, the statistical analysis conducted on geographies consisting of 66,176,849 people shows a substantial positive correlation between the proportion of Cheyenne and percentage of population with a disability under the age of 5 in the United States with a correlation coefficient (R) of 0.573 and weighted average of 1.5%, a difference of 34.0%.
Disability Age Under 5 Correlation Summary
| Measurement | Immigrants from Jordan | Cheyenne |
| Minimum | 0.48% | 0.85% |
| Maximum | 3.5% | 25.0% |
| Range | 3.0% | 24.1% |
| Mean | 1.6% | 10.6% |
| Median | 1.3% | 9.0% |
| Interquartile 25% (IQ1) | 1.0% | 2.9% |
| Interquartile 75% (IQ3) | 1.8% | 19.4% |
| Interquartile Range (IQR) | 0.80% | 16.4% |
| Standard Deviation (Sample) | 0.78% | 8.6% |
| Standard Deviation (Population) | 0.76% | 8.1% |
Similar Demographics by Disability Age Under 5
Demographics Similar to Immigrants from Jordan by Disability Age Under 5
In terms of disability age under 5, the demographic groups most similar to Immigrants from Jordan are Immigrants from Syria (1.1%, a difference of 0.010%), Turkish (1.1%, a difference of 0.11%), Immigrants from Trinidad and Tobago (1.1%, a difference of 0.13%), Hmong (1.1%, a difference of 0.16%), and Immigrants from Zaire (1.1%, a difference of 0.16%).
| Demographics | Rating | Rank | Disability Age Under 5 |
| Immigrants | Pakistan | 98.4 /100 | #75 | Exceptional 1.1% |
| Immigrants | Burma/Myanmar | 98.2 /100 | #76 | Exceptional 1.1% |
| Immigrants | Denmark | 98.1 /100 | #77 | Exceptional 1.1% |
| West Indians | 98.0 /100 | #78 | Exceptional 1.1% |
| Hmong | 98.0 /100 | #79 | Exceptional 1.1% |
| Immigrants | Trinidad and Tobago | 98.0 /100 | #80 | Exceptional 1.1% |
| Turks | 98.0 /100 | #81 | Exceptional 1.1% |
| Immigrants | Jordan | 97.9 /100 | #82 | Exceptional 1.1% |
| Immigrants | Syria | 97.9 /100 | #83 | Exceptional 1.1% |
| Immigrants | Zaire | 97.8 /100 | #84 | Exceptional 1.1% |
| Sudanese | 97.7 /100 | #85 | Exceptional 1.1% |
| Okinawans | 97.6 /100 | #86 | Exceptional 1.1% |
| Ugandans | 97.5 /100 | #87 | Exceptional 1.1% |
| Immigrants | Dominican Republic | 97.5 /100 | #88 | Exceptional 1.1% |
| Ethiopians | 97.2 /100 | #89 | Exceptional 1.1% |
Demographics Similar to Cheyenne by Disability Age Under 5
In terms of disability age under 5, the demographic groups most similar to Cheyenne are Delaware (1.5%, a difference of 0.19%), European (1.5%, a difference of 0.25%), Czechoslovakian (1.5%, a difference of 0.34%), Croatian (1.5%, a difference of 1.4%), and Tlingit-Haida (1.5%, a difference of 1.7%).
| Demographics | Rating | Rank | Disability Age Under 5 |
| Brazilians | 0.0 /100 | #275 | Tragic 1.5% |
| Greeks | 0.0 /100 | #276 | Tragic 1.5% |
| Canadians | 0.0 /100 | #277 | Tragic 1.5% |
| Kiowa | 0.0 /100 | #278 | Tragic 1.5% |
| Danes | 0.0 /100 | #279 | Tragic 1.5% |
| British | 0.0 /100 | #280 | Tragic 1.5% |
| Czechoslovakians | 0.0 /100 | #281 | Tragic 1.5% |
| Cheyenne | 0.0 /100 | #282 | Tragic 1.5% |
| Delaware | 0.0 /100 | #283 | Tragic 1.5% |
| Europeans | 0.0 /100 | #284 | Tragic 1.5% |
| Croatians | 0.0 /100 | #285 | Tragic 1.5% |
| Tlingit-Haida | 0.0 /100 | #286 | Tragic 1.5% |
| Scandinavians | 0.0 /100 | #287 | Tragic 1.5% |
| Estonians | 0.0 /100 | #288 | Tragic 1.5% |
| Hungarians | 0.0 /100 | #289 | Tragic 1.5% |