Welsh vs Immigrants from Eastern Africa Disability Age Under 5
COMPARE
Welsh
Immigrants from Eastern Africa
Disability Age Under 5
Disability Age Under 5 Comparison
Welsh
Immigrants from Eastern Africa
1.6%
DISABILITY AGE UNDER 5
0.0/ 100
METRIC RATING
302nd/ 347
METRIC RANK
1.2%
DISABILITY AGE UNDER 5
83.1/ 100
METRIC RATING
137th/ 347
METRIC RANK
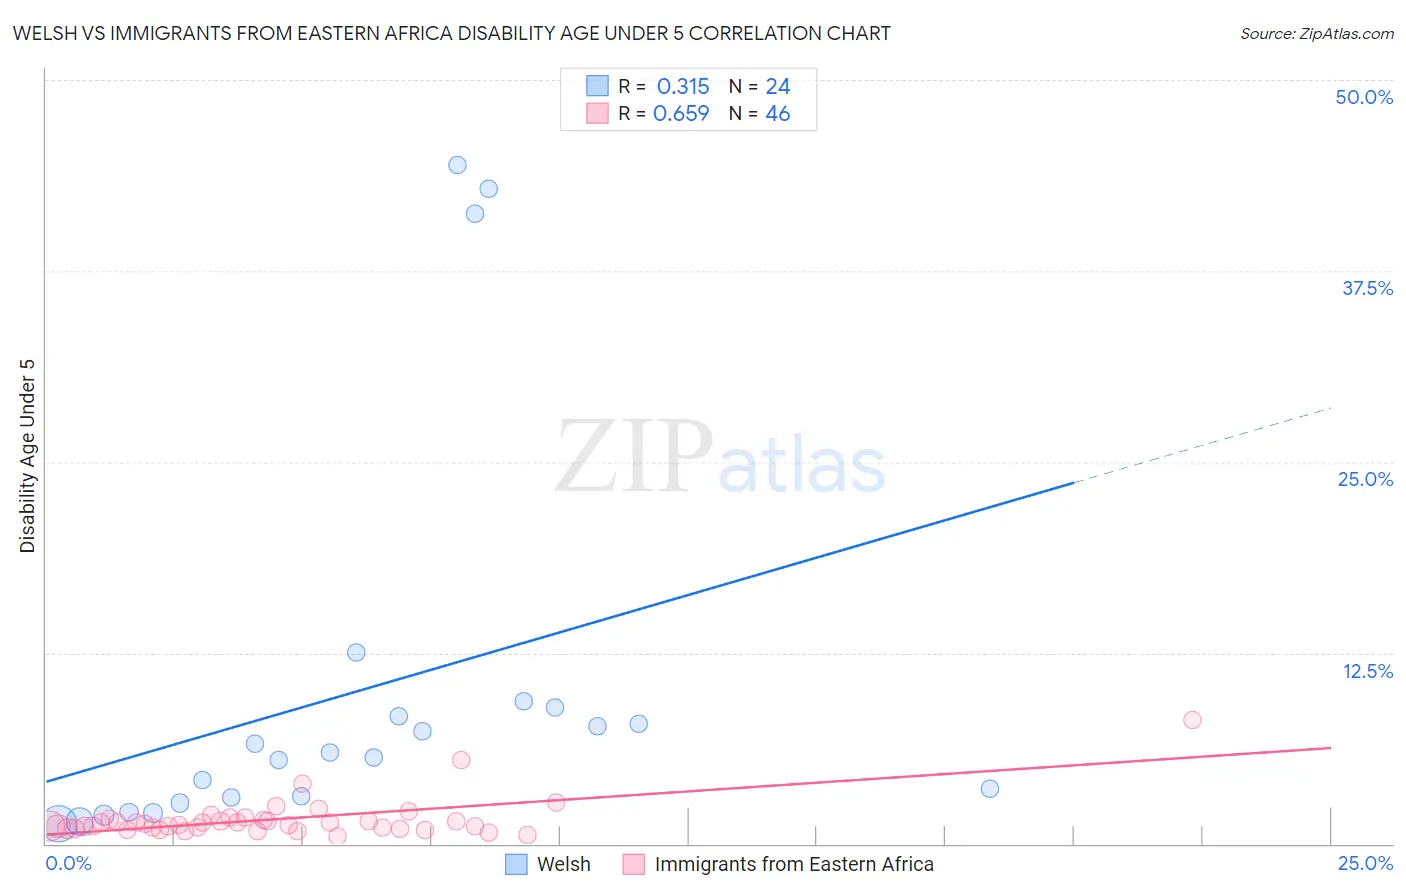
Welsh vs Immigrants from Eastern Africa Disability Age Under 5 Correlation Chart
The statistical analysis conducted on geographies consisting of 248,340,053 people shows a mild positive correlation between the proportion of Welsh and percentage of population with a disability under the age of 5 in the United States with a correlation coefficient (R) of 0.315 and weighted average of 1.6%. Similarly, the statistical analysis conducted on geographies consisting of 202,266,724 people shows a significant positive correlation between the proportion of Immigrants from Eastern Africa and percentage of population with a disability under the age of 5 in the United States with a correlation coefficient (R) of 0.659 and weighted average of 1.2%, a difference of 36.3%.
Disability Age Under 5 Correlation Summary
| Measurement | Welsh | Immigrants from Eastern Africa |
| Minimum | 1.3% | 0.48% |
| Maximum | 44.4% | 8.1% |
| Range | 43.1% | 7.6% |
| Mean | 10.0% | 1.6% |
| Median | 5.8% | 1.3% |
| Interquartile 25% (IQ1) | 2.8% | 0.98% |
| Interquartile 75% (IQ3) | 8.6% | 1.6% |
| Interquartile Range (IQR) | 5.8% | 0.60% |
| Standard Deviation (Sample) | 13.0% | 1.3% |
| Standard Deviation (Population) | 12.8% | 1.3% |
Similar Demographics by Disability Age Under 5
Demographics Similar to Welsh by Disability Age Under 5
In terms of disability age under 5, the demographic groups most similar to Welsh are German Russian (1.6%, a difference of 0.12%), Swiss (1.6%, a difference of 0.16%), Shoshone (1.6%, a difference of 0.56%), Seminole (1.6%, a difference of 0.79%), and Portuguese (1.6%, a difference of 0.89%).
| Demographics | Rating | Rank | Disability Age Under 5 |
| Finns | 0.0 /100 | #295 | Tragic 1.6% |
| Poles | 0.0 /100 | #296 | Tragic 1.6% |
| Immigrants | Nonimmigrants | 0.0 /100 | #297 | Tragic 1.6% |
| Cajuns | 0.0 /100 | #298 | Tragic 1.6% |
| Portuguese | 0.0 /100 | #299 | Tragic 1.6% |
| Shoshone | 0.0 /100 | #300 | Tragic 1.6% |
| German Russians | 0.0 /100 | #301 | Tragic 1.6% |
| Welsh | 0.0 /100 | #302 | Tragic 1.6% |
| Swiss | 0.0 /100 | #303 | Tragic 1.6% |
| Seminole | 0.0 /100 | #304 | Tragic 1.6% |
| Blackfeet | 0.0 /100 | #305 | Tragic 1.6% |
| Creek | 0.0 /100 | #306 | Tragic 1.6% |
| Scottish | 0.0 /100 | #307 | Tragic 1.6% |
| Navajo | 0.0 /100 | #308 | Tragic 1.6% |
| Cape Verdeans | 0.0 /100 | #309 | Tragic 1.7% |
Demographics Similar to Immigrants from Eastern Africa by Disability Age Under 5
In terms of disability age under 5, the demographic groups most similar to Immigrants from Eastern Africa are Immigrants from Czechoslovakia (1.2%, a difference of 0.050%), Moroccan (1.2%, a difference of 0.090%), Fijian (1.2%, a difference of 0.27%), New Zealander (1.2%, a difference of 0.28%), and Somali (1.2%, a difference of 0.37%).
| Demographics | Rating | Rank | Disability Age Under 5 |
| Koreans | 87.7 /100 | #130 | Excellent 1.2% |
| Immigrants | Serbia | 87.6 /100 | #131 | Excellent 1.2% |
| Immigrants | Eastern Europe | 87.3 /100 | #132 | Excellent 1.2% |
| Immigrants | Spain | 86.5 /100 | #133 | Excellent 1.2% |
| Argentineans | 85.7 /100 | #134 | Excellent 1.2% |
| Fijians | 84.7 /100 | #135 | Excellent 1.2% |
| Moroccans | 83.6 /100 | #136 | Excellent 1.2% |
| Immigrants | Eastern Africa | 83.1 /100 | #137 | Excellent 1.2% |
| Immigrants | Czechoslovakia | 82.8 /100 | #138 | Excellent 1.2% |
| New Zealanders | 81.4 /100 | #139 | Excellent 1.2% |
| Somalis | 80.8 /100 | #140 | Excellent 1.2% |
| Immigrants | Honduras | 80.4 /100 | #141 | Excellent 1.2% |
| Immigrants | Colombia | 79.3 /100 | #142 | Good 1.2% |
| Alsatians | 79.3 /100 | #143 | Good 1.2% |
| Immigrants | Middle Africa | 79.3 /100 | #144 | Good 1.2% |