Welsh vs Tohono O'odham Disability Age Under 5
COMPARE
Welsh
Tohono O'odham
Disability Age Under 5
Disability Age Under 5 Comparison
Welsh
Tohono O'odham
1.6%
DISABILITY AGE UNDER 5
0.0/ 100
METRIC RATING
302nd/ 347
METRIC RANK
2.2%
DISABILITY AGE UNDER 5
0.0/ 100
METRIC RATING
338th/ 347
METRIC RANK
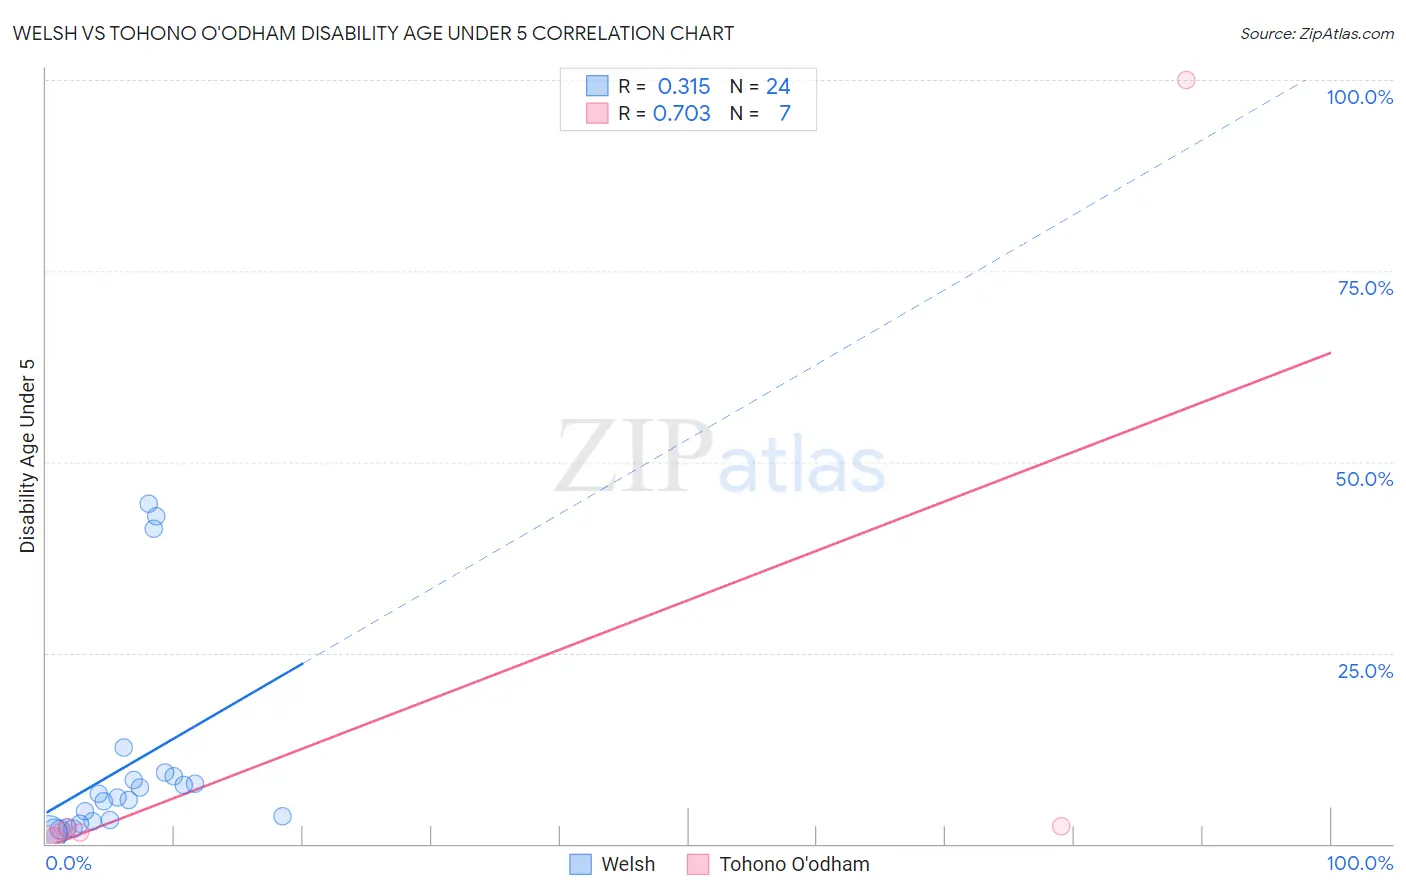
Welsh vs Tohono O'odham Disability Age Under 5 Correlation Chart
The statistical analysis conducted on geographies consisting of 248,340,053 people shows a mild positive correlation between the proportion of Welsh and percentage of population with a disability under the age of 5 in the United States with a correlation coefficient (R) of 0.315 and weighted average of 1.6%. Similarly, the statistical analysis conducted on geographies consisting of 51,779,749 people shows a strong positive correlation between the proportion of Tohono O'odham and percentage of population with a disability under the age of 5 in the United States with a correlation coefficient (R) of 0.703 and weighted average of 2.2%, a difference of 34.2%.
Disability Age Under 5 Correlation Summary
| Measurement | Welsh | Tohono O'odham |
| Minimum | 1.3% | 0.81% |
| Maximum | 44.4% | 100.0% |
| Range | 43.1% | 99.2% |
| Mean | 10.0% | 15.6% |
| Median | 5.8% | 1.6% |
| Interquartile 25% (IQ1) | 2.8% | 1.0% |
| Interquartile 75% (IQ3) | 8.6% | 2.3% |
| Interquartile Range (IQR) | 5.8% | 1.2% |
| Standard Deviation (Sample) | 13.0% | 37.2% |
| Standard Deviation (Population) | 12.8% | 34.5% |
Similar Demographics by Disability Age Under 5
Demographics Similar to Welsh by Disability Age Under 5
In terms of disability age under 5, the demographic groups most similar to Welsh are German Russian (1.6%, a difference of 0.12%), Swiss (1.6%, a difference of 0.16%), Shoshone (1.6%, a difference of 0.56%), Seminole (1.6%, a difference of 0.79%), and Portuguese (1.6%, a difference of 0.89%).
| Demographics | Rating | Rank | Disability Age Under 5 |
| Finns | 0.0 /100 | #295 | Tragic 1.6% |
| Poles | 0.0 /100 | #296 | Tragic 1.6% |
| Immigrants | Nonimmigrants | 0.0 /100 | #297 | Tragic 1.6% |
| Cajuns | 0.0 /100 | #298 | Tragic 1.6% |
| Portuguese | 0.0 /100 | #299 | Tragic 1.6% |
| Shoshone | 0.0 /100 | #300 | Tragic 1.6% |
| German Russians | 0.0 /100 | #301 | Tragic 1.6% |
| Welsh | 0.0 /100 | #302 | Tragic 1.6% |
| Swiss | 0.0 /100 | #303 | Tragic 1.6% |
| Seminole | 0.0 /100 | #304 | Tragic 1.6% |
| Blackfeet | 0.0 /100 | #305 | Tragic 1.6% |
| Creek | 0.0 /100 | #306 | Tragic 1.6% |
| Scottish | 0.0 /100 | #307 | Tragic 1.6% |
| Navajo | 0.0 /100 | #308 | Tragic 1.6% |
| Cape Verdeans | 0.0 /100 | #309 | Tragic 1.7% |
Demographics Similar to Tohono O'odham by Disability Age Under 5
In terms of disability age under 5, the demographic groups most similar to Tohono O'odham are Immigrants from the Azores (2.2%, a difference of 2.2%), Menominee (2.3%, a difference of 5.0%), Apache (2.0%, a difference of 7.6%), Tsimshian (2.4%, a difference of 10.2%), and Paraguayan (2.0%, a difference of 10.7%).
| Demographics | Rating | Rank | Disability Age Under 5 |
| French Canadians | 0.0 /100 | #331 | Tragic 1.9% |
| Chippewa | 0.0 /100 | #332 | Tragic 1.9% |
| Dutch West Indians | 0.0 /100 | #333 | Tragic 1.9% |
| Natives/Alaskans | 0.0 /100 | #334 | Tragic 1.9% |
| Pennsylvania Germans | 0.0 /100 | #335 | Tragic 1.9% |
| Paraguayans | 0.0 /100 | #336 | Tragic 2.0% |
| Apache | 0.0 /100 | #337 | Tragic 2.0% |
| Tohono O'odham | 0.0 /100 | #338 | Tragic 2.2% |
| Immigrants | Azores | 0.0 /100 | #339 | Tragic 2.2% |
| Menominee | 0.0 /100 | #340 | Tragic 2.3% |
| Tsimshian | 0.0 /100 | #341 | Tragic 2.4% |
| Alaska Natives | 0.0 /100 | #342 | Tragic 2.9% |
| Colville | 0.0 /100 | #343 | Tragic 3.3% |
| Inupiat | 0.0 /100 | #344 | Tragic 3.7% |
| Paiute | 0.0 /100 | #345 | Tragic 3.9% |