Tlingit-Haida vs Scandinavian Per Capita Income
COMPARE
Tlingit-Haida
Scandinavian
Per Capita Income
Per Capita Income Comparison
Tlingit-Haida
Scandinavians
$43,516
PER CAPITA INCOME
45.9/ 100
METRIC RATING
177th/ 347
METRIC RANK
$43,848
PER CAPITA INCOME
55.2/ 100
METRIC RATING
170th/ 347
METRIC RANK
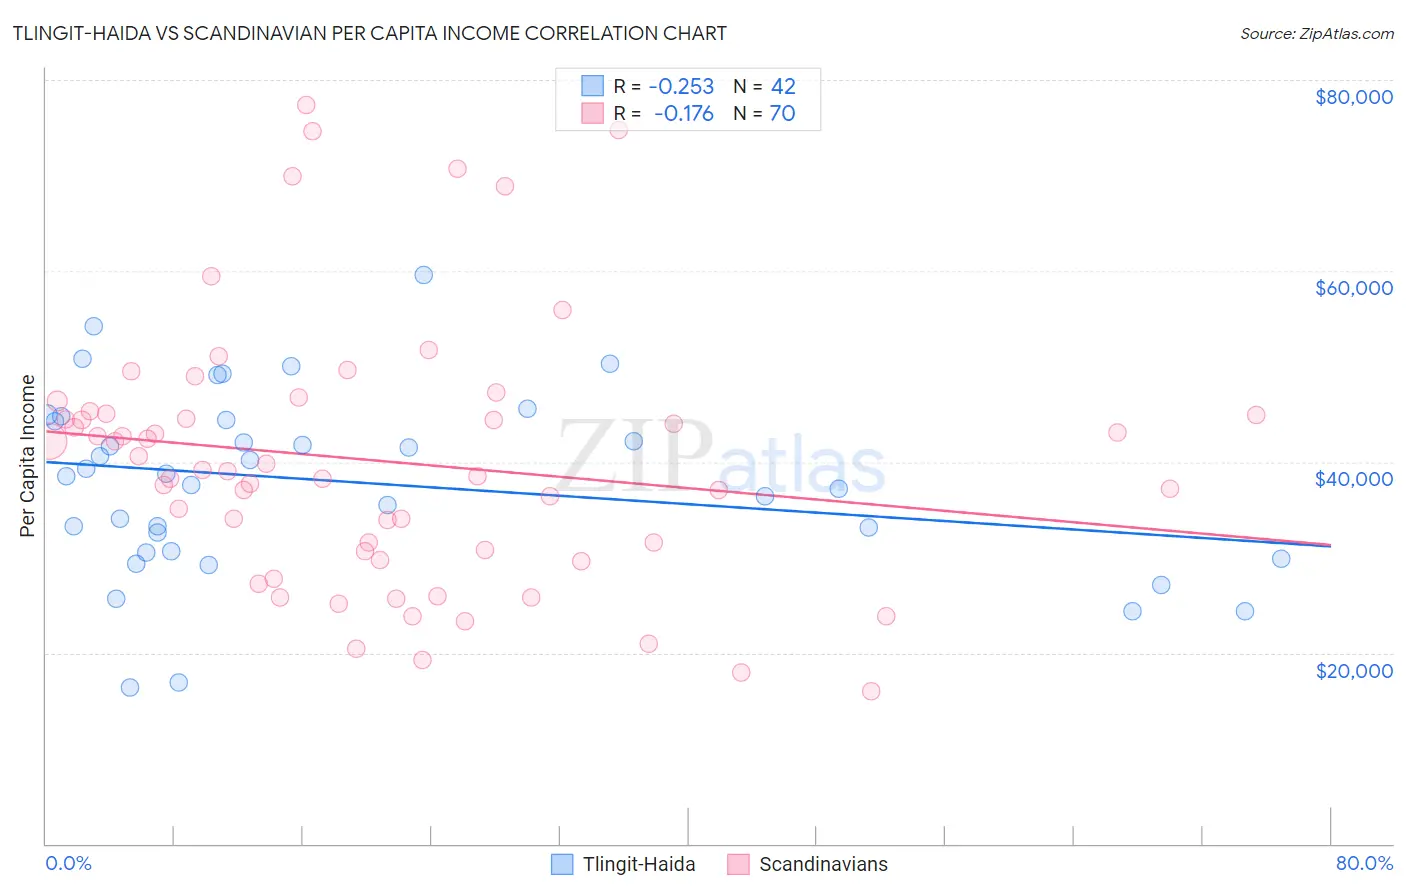
Tlingit-Haida vs Scandinavian Per Capita Income Correlation Chart
The statistical analysis conducted on geographies consisting of 60,872,339 people shows a weak negative correlation between the proportion of Tlingit-Haida and per capita income in the United States with a correlation coefficient (R) of -0.253 and weighted average of $43,516. Similarly, the statistical analysis conducted on geographies consisting of 472,676,138 people shows a poor negative correlation between the proportion of Scandinavians and per capita income in the United States with a correlation coefficient (R) of -0.176 and weighted average of $43,848, a difference of 0.76%.
Per Capita Income Correlation Summary
| Measurement | Tlingit-Haida | Scandinavian |
| Minimum | $16,326 | $15,911 |
| Maximum | $59,619 | $77,383 |
| Range | $43,293 | $61,472 |
| Mean | $37,894 | $40,106 |
| Median | $38,682 | $39,048 |
| Interquartile 25% (IQ1) | $30,599 | $30,666 |
| Interquartile 75% (IQ3) | $44,372 | $45,055 |
| Interquartile Range (IQR) | $13,773 | $14,389 |
| Standard Deviation (Sample) | $9,586 | $13,782 |
| Standard Deviation (Population) | $9,471 | $13,683 |
Demographics Similar to Tlingit-Haida and Scandinavians by Per Capita Income
In terms of per capita income, the demographic groups most similar to Tlingit-Haida are Immigrants from South Eastern Asia ($43,539, a difference of 0.050%), Immigrants from Costa Rica ($43,464, a difference of 0.12%), Finnish ($43,461, a difference of 0.13%), Celtic ($43,621, a difference of 0.24%), and Sierra Leonean ($43,405, a difference of 0.25%). Similarly, the demographic groups most similar to Scandinavians are Immigrants from Peru ($43,852, a difference of 0.010%), Immigrants from Eastern Africa ($43,838, a difference of 0.020%), Czechoslovakian ($43,806, a difference of 0.090%), Belgian ($43,951, a difference of 0.24%), and English ($43,982, a difference of 0.31%).
| Demographics | Rating | Rank | Per Capita Income |
| Immigrants | South America | 61.2 /100 | #163 | Good $44,068 |
| Sri Lankans | 59.8 /100 | #164 | Average $44,014 |
| Immigrants | Philippines | 59.4 /100 | #165 | Average $44,000 |
| Immigrants | Uruguay | 59.3 /100 | #166 | Average $43,997 |
| English | 58.9 /100 | #167 | Average $43,982 |
| Belgians | 58.1 /100 | #168 | Average $43,951 |
| Immigrants | Peru | 55.3 /100 | #169 | Average $43,852 |
| Scandinavians | 55.2 /100 | #170 | Average $43,848 |
| Immigrants | Eastern Africa | 54.9 /100 | #171 | Average $43,838 |
| Czechoslovakians | 54.1 /100 | #172 | Average $43,806 |
| French | 50.7 /100 | #173 | Average $43,685 |
| Colombians | 50.0 /100 | #174 | Average $43,661 |
| Celtics | 48.9 /100 | #175 | Average $43,621 |
| Immigrants | South Eastern Asia | 46.6 /100 | #176 | Average $43,539 |
| Tlingit-Haida | 45.9 /100 | #177 | Average $43,516 |
| Immigrants | Costa Rica | 44.5 /100 | #178 | Average $43,464 |
| Finns | 44.4 /100 | #179 | Average $43,461 |
| Sierra Leoneans | 42.9 /100 | #180 | Average $43,405 |
| Welsh | 38.2 /100 | #181 | Fair $43,233 |
| Immigrants | Vietnam | 38.1 /100 | #182 | Fair $43,229 |
| Germans | 33.9 /100 | #183 | Fair $43,067 |