Immigrants from Venezuela vs Scandinavian Disability Age Over 75
COMPARE
Immigrants from Venezuela
Scandinavian
Disability Age Over 75
Disability Age Over 75 Comparison
Immigrants from Venezuela
Scandinavians
46.8%
DISABILITY AGE OVER 75
88.6/ 100
METRIC RATING
136th/ 347
METRIC RANK
46.6%
DISABILITY AGE OVER 75
93.6/ 100
METRIC RATING
121st/ 347
METRIC RANK
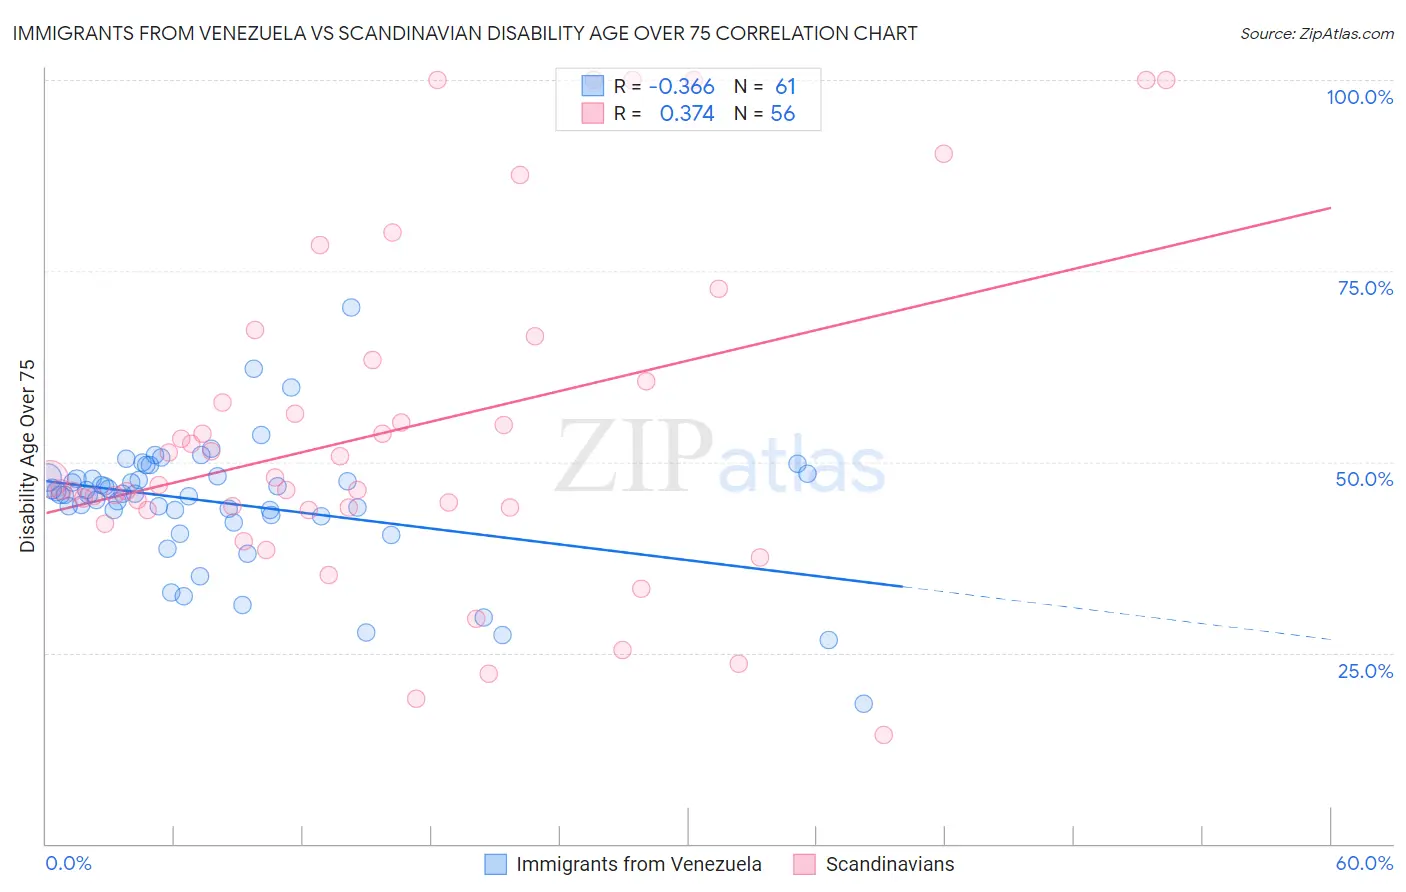
Immigrants from Venezuela vs Scandinavian Disability Age Over 75 Correlation Chart
The statistical analysis conducted on geographies consisting of 287,644,311 people shows a mild negative correlation between the proportion of Immigrants from Venezuela and percentage of population with a disability over the age of 75 in the United States with a correlation coefficient (R) of -0.366 and weighted average of 46.8%. Similarly, the statistical analysis conducted on geographies consisting of 471,447,012 people shows a mild positive correlation between the proportion of Scandinavians and percentage of population with a disability over the age of 75 in the United States with a correlation coefficient (R) of 0.374 and weighted average of 46.6%, a difference of 0.36%.
Disability Age Over 75 Correlation Summary
| Measurement | Immigrants from Venezuela | Scandinavian |
| Minimum | 18.4% | 14.3% |
| Maximum | 70.3% | 100.0% |
| Range | 51.9% | 85.7% |
| Mean | 44.5% | 54.2% |
| Median | 45.8% | 47.4% |
| Interquartile 25% (IQ1) | 42.9% | 43.9% |
| Interquartile 75% (IQ3) | 48.0% | 62.0% |
| Interquartile Range (IQR) | 5.1% | 18.1% |
| Standard Deviation (Sample) | 8.4% | 21.9% |
| Standard Deviation (Population) | 8.3% | 21.7% |
Demographics Similar to Immigrants from Venezuela and Scandinavians by Disability Age Over 75
In terms of disability age over 75, the demographic groups most similar to Immigrants from Venezuela are Immigrants from Uganda (46.8%, a difference of 0.0%), Ethiopian (46.8%, a difference of 0.010%), Immigrants from Bosnia and Herzegovina (46.8%, a difference of 0.010%), Immigrants from Ethiopia (46.8%, a difference of 0.030%), and English (46.8%, a difference of 0.040%). Similarly, the demographic groups most similar to Scandinavians are Immigrants from Nepal (46.6%, a difference of 0.050%), Immigrants from Albania (46.6%, a difference of 0.050%), Canadian (46.6%, a difference of 0.080%), Czechoslovakian (46.6%, a difference of 0.10%), and Immigrants from Colombia (46.7%, a difference of 0.10%).
| Demographics | Rating | Rank | Disability Age Over 75 |
| Czechoslovakians | 94.7 /100 | #118 | Exceptional 46.6% |
| Canadians | 94.4 /100 | #119 | Exceptional 46.6% |
| Immigrants | Nepal | 94.1 /100 | #120 | Exceptional 46.6% |
| Scandinavians | 93.6 /100 | #121 | Exceptional 46.6% |
| Immigrants | Albania | 93.2 /100 | #122 | Exceptional 46.6% |
| Immigrants | Colombia | 92.6 /100 | #123 | Exceptional 46.7% |
| Immigrants | South America | 91.8 /100 | #124 | Exceptional 46.7% |
| Colombians | 91.3 /100 | #125 | Exceptional 46.7% |
| Europeans | 91.2 /100 | #126 | Exceptional 46.7% |
| Syrians | 91.1 /100 | #127 | Exceptional 46.7% |
| Icelanders | 90.9 /100 | #128 | Exceptional 46.7% |
| Immigrants | Germany | 90.8 /100 | #129 | Exceptional 46.7% |
| Immigrants | Northern Africa | 90.7 /100 | #130 | Exceptional 46.7% |
| Scottish | 90.5 /100 | #131 | Exceptional 46.7% |
| South Americans | 90.0 /100 | #132 | Excellent 46.8% |
| English | 89.4 /100 | #133 | Excellent 46.8% |
| Immigrants | Ethiopia | 89.1 /100 | #134 | Excellent 46.8% |
| Ethiopians | 88.9 /100 | #135 | Excellent 46.8% |
| Immigrants | Venezuela | 88.6 /100 | #136 | Excellent 46.8% |
| Immigrants | Uganda | 88.5 /100 | #137 | Excellent 46.8% |
| Immigrants | Bosnia and Herzegovina | 88.5 /100 | #138 | Excellent 46.8% |