Luxembourger vs Carpatho Rusyn Disability Age Over 75
COMPARE
Luxembourger
Carpatho Rusyn
Disability Age Over 75
Disability Age Over 75 Comparison
Luxembourgers
Carpatho Rusyns
44.8%
DISABILITY AGE OVER 75
100.0/ 100
METRIC RATING
5th/ 347
METRIC RANK
44.8%
DISABILITY AGE OVER 75
100.0/ 100
METRIC RATING
4th/ 347
METRIC RANK
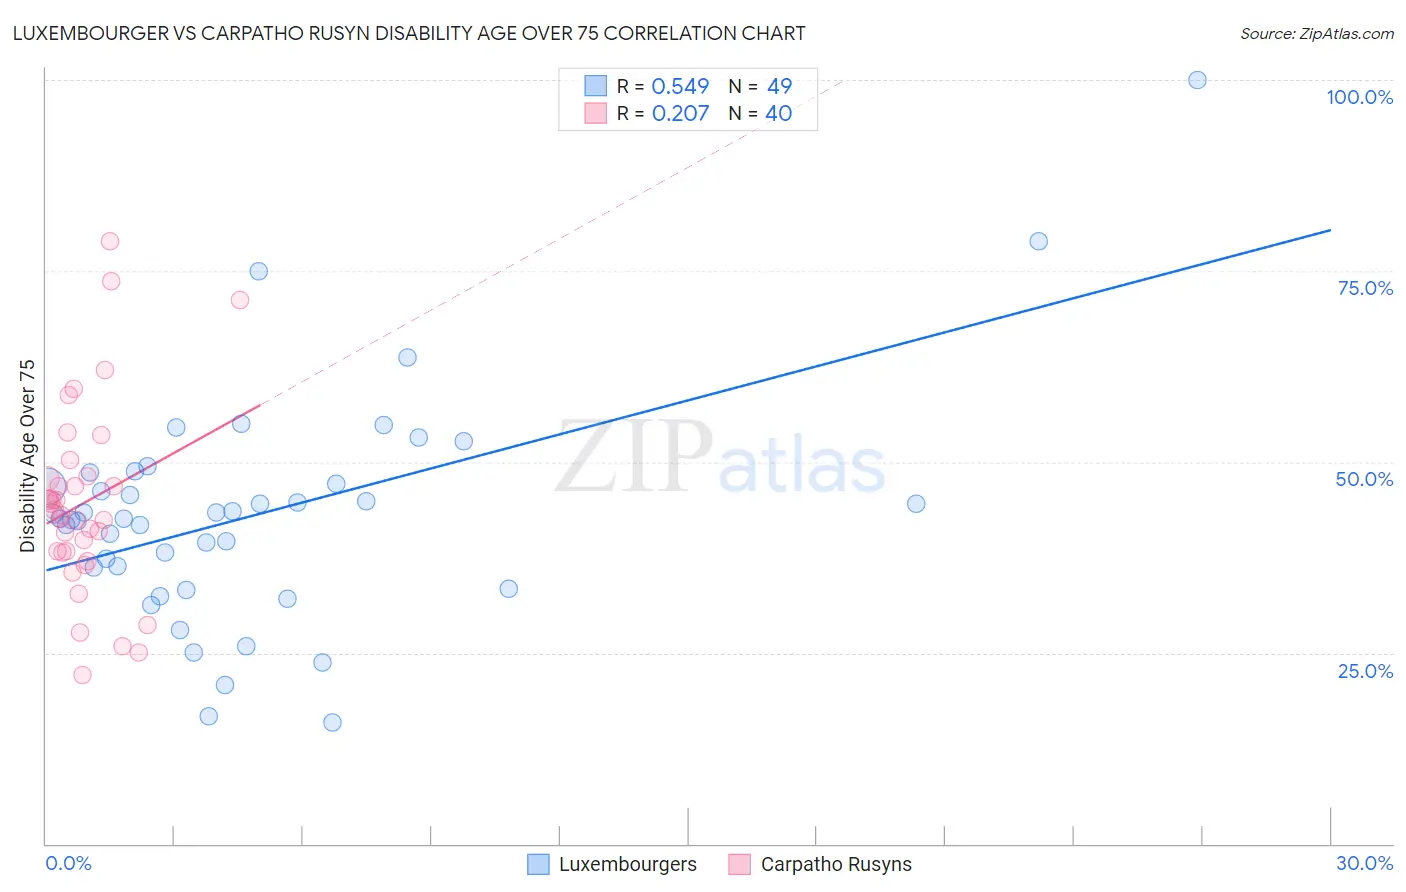
Luxembourger vs Carpatho Rusyn Disability Age Over 75 Correlation Chart
The statistical analysis conducted on geographies consisting of 144,572,010 people shows a substantial positive correlation between the proportion of Luxembourgers and percentage of population with a disability over the age of 75 in the United States with a correlation coefficient (R) of 0.549 and weighted average of 44.8%. Similarly, the statistical analysis conducted on geographies consisting of 58,869,568 people shows a weak positive correlation between the proportion of Carpatho Rusyns and percentage of population with a disability over the age of 75 in the United States with a correlation coefficient (R) of 0.207 and weighted average of 44.8%, a difference of 0.060%.
Disability Age Over 75 Correlation Summary
| Measurement | Luxembourger | Carpatho Rusyn |
| Minimum | 15.9% | 22.1% |
| Maximum | 100.0% | 78.8% |
| Range | 84.1% | 56.8% |
| Mean | 43.1% | 44.6% |
| Median | 42.5% | 43.3% |
| Interquartile 25% (IQ1) | 34.8% | 38.2% |
| Interquartile 75% (IQ3) | 47.9% | 48.0% |
| Interquartile Range (IQR) | 13.1% | 9.8% |
| Standard Deviation (Sample) | 14.9% | 12.4% |
| Standard Deviation (Population) | 14.7% | 12.3% |
Demographics Similar to Luxembourgers and Carpatho Rusyns by Disability Age Over 75
In terms of disability age over 75, the demographic groups most similar to Luxembourgers are Eastern European (44.8%, a difference of 0.090%), Immigrants from Lithuania (44.9%, a difference of 0.090%), Okinawan (44.9%, a difference of 0.13%), Immigrants from Austria (44.9%, a difference of 0.25%), and Paraguayan (45.0%, a difference of 0.33%). Similarly, the demographic groups most similar to Carpatho Rusyns are Eastern European (44.8%, a difference of 0.030%), Immigrants from Lithuania (44.9%, a difference of 0.15%), Okinawan (44.9%, a difference of 0.19%), Immigrants from Austria (44.9%, a difference of 0.31%), and Immigrants from Ireland (44.7%, a difference of 0.32%).
| Demographics | Rating | Rank | Disability Age Over 75 |
| Cypriots | 100.0 /100 | #1 | Exceptional 43.5% |
| Immigrants | Ireland | 100.0 /100 | #2 | Exceptional 44.7% |
| Eastern Europeans | 100.0 /100 | #3 | Exceptional 44.8% |
| Carpatho Rusyns | 100.0 /100 | #4 | Exceptional 44.8% |
| Luxembourgers | 100.0 /100 | #5 | Exceptional 44.8% |
| Immigrants | Lithuania | 100.0 /100 | #6 | Exceptional 44.9% |
| Okinawans | 100.0 /100 | #7 | Exceptional 44.9% |
| Immigrants | Austria | 100.0 /100 | #8 | Exceptional 44.9% |
| Paraguayans | 100.0 /100 | #9 | Exceptional 45.0% |
| Bulgarians | 100.0 /100 | #10 | Exceptional 45.1% |
| Lithuanians | 100.0 /100 | #11 | Exceptional 45.1% |
| Immigrants | Czechoslovakia | 100.0 /100 | #12 | Exceptional 45.1% |
| Latvians | 100.0 /100 | #13 | Exceptional 45.1% |
| Immigrants | Scotland | 100.0 /100 | #14 | Exceptional 45.1% |
| Immigrants | Sweden | 100.0 /100 | #15 | Exceptional 45.1% |
| Immigrants | Northern Europe | 100.0 /100 | #16 | Exceptional 45.2% |
| Immigrants | India | 100.0 /100 | #17 | Exceptional 45.2% |
| Bolivians | 100.0 /100 | #18 | Exceptional 45.2% |
| Immigrants | Greece | 100.0 /100 | #19 | Exceptional 45.2% |
| Immigrants | Serbia | 100.0 /100 | #20 | Exceptional 45.3% |