Belizean vs Carpatho Rusyn Disability Age Over 75
COMPARE
Belizean
Carpatho Rusyn
Disability Age Over 75
Disability Age Over 75 Comparison
Belizeans
Carpatho Rusyns
49.4%
DISABILITY AGE OVER 75
0.0/ 100
METRIC RATING
281st/ 347
METRIC RANK
44.8%
DISABILITY AGE OVER 75
100.0/ 100
METRIC RATING
4th/ 347
METRIC RANK
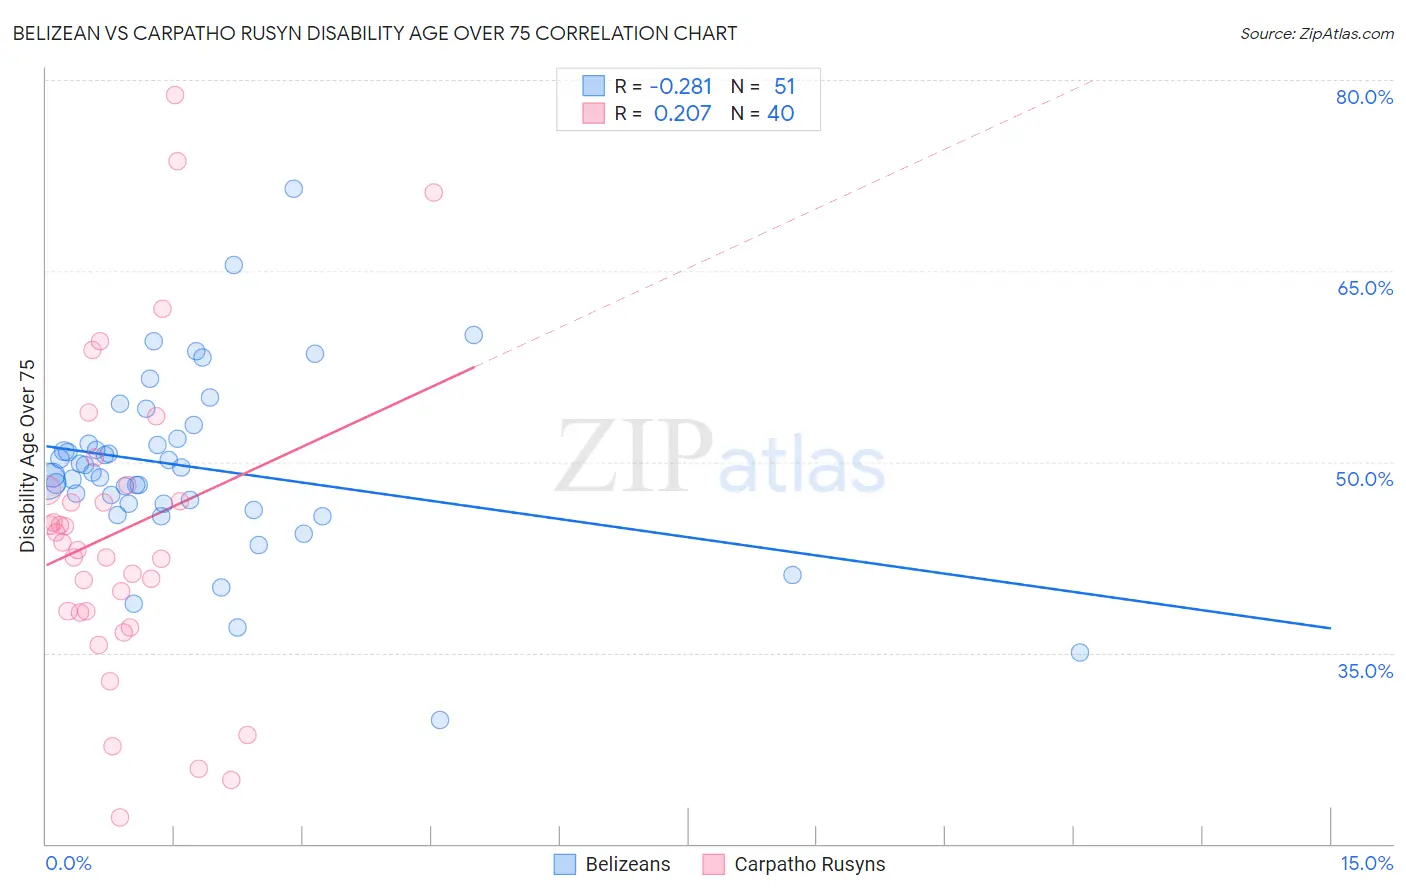
Belizean vs Carpatho Rusyn Disability Age Over 75 Correlation Chart
The statistical analysis conducted on geographies consisting of 144,100,145 people shows a weak negative correlation between the proportion of Belizeans and percentage of population with a disability over the age of 75 in the United States with a correlation coefficient (R) of -0.281 and weighted average of 49.4%. Similarly, the statistical analysis conducted on geographies consisting of 58,869,568 people shows a weak positive correlation between the proportion of Carpatho Rusyns and percentage of population with a disability over the age of 75 in the United States with a correlation coefficient (R) of 0.207 and weighted average of 44.8%, a difference of 10.3%.
Disability Age Over 75 Correlation Summary
| Measurement | Belizean | Carpatho Rusyn |
| Minimum | 29.7% | 22.1% |
| Maximum | 71.4% | 78.8% |
| Range | 41.7% | 56.8% |
| Mean | 49.6% | 44.6% |
| Median | 49.1% | 43.3% |
| Interquartile 25% (IQ1) | 46.7% | 38.2% |
| Interquartile 75% (IQ3) | 51.8% | 48.0% |
| Interquartile Range (IQR) | 5.1% | 9.8% |
| Standard Deviation (Sample) | 7.1% | 12.4% |
| Standard Deviation (Population) | 7.0% | 12.3% |
Similar Demographics by Disability Age Over 75
Demographics Similar to Belizeans by Disability Age Over 75
In terms of disability age over 75, the demographic groups most similar to Belizeans are Bangladeshi (49.4%, a difference of 0.0%), Guamanian/Chamorro (49.4%, a difference of 0.070%), Black/African American (49.5%, a difference of 0.14%), Samoan (49.5%, a difference of 0.17%), and Immigrants from Latin America (49.5%, a difference of 0.22%).
| Demographics | Rating | Rank | Disability Age Over 75 |
| Immigrants | Guatemala | 0.1 /100 | #274 | Tragic 49.1% |
| Immigrants | Dominica | 0.1 /100 | #275 | Tragic 49.1% |
| Immigrants | Uzbekistan | 0.1 /100 | #276 | Tragic 49.2% |
| Hawaiians | 0.1 /100 | #277 | Tragic 49.2% |
| Immigrants | Laos | 0.1 /100 | #278 | Tragic 49.2% |
| Guamanians/Chamorros | 0.0 /100 | #279 | Tragic 49.4% |
| Bangladeshis | 0.0 /100 | #280 | Tragic 49.4% |
| Belizeans | 0.0 /100 | #281 | Tragic 49.4% |
| Blacks/African Americans | 0.0 /100 | #282 | Tragic 49.5% |
| Samoans | 0.0 /100 | #283 | Tragic 49.5% |
| Immigrants | Latin America | 0.0 /100 | #284 | Tragic 49.5% |
| Crow | 0.0 /100 | #285 | Tragic 49.6% |
| Immigrants | Belize | 0.0 /100 | #286 | Tragic 49.6% |
| Sioux | 0.0 /100 | #287 | Tragic 49.7% |
| Yaqui | 0.0 /100 | #288 | Tragic 49.8% |
Demographics Similar to Carpatho Rusyns by Disability Age Over 75
In terms of disability age over 75, the demographic groups most similar to Carpatho Rusyns are Eastern European (44.8%, a difference of 0.030%), Luxembourger (44.8%, a difference of 0.060%), Immigrants from Lithuania (44.9%, a difference of 0.15%), Okinawan (44.9%, a difference of 0.19%), and Immigrants from Austria (44.9%, a difference of 0.31%).
| Demographics | Rating | Rank | Disability Age Over 75 |
| Cypriots | 100.0 /100 | #1 | Exceptional 43.5% |
| Immigrants | Ireland | 100.0 /100 | #2 | Exceptional 44.7% |
| Eastern Europeans | 100.0 /100 | #3 | Exceptional 44.8% |
| Carpatho Rusyns | 100.0 /100 | #4 | Exceptional 44.8% |
| Luxembourgers | 100.0 /100 | #5 | Exceptional 44.8% |
| Immigrants | Lithuania | 100.0 /100 | #6 | Exceptional 44.9% |
| Okinawans | 100.0 /100 | #7 | Exceptional 44.9% |
| Immigrants | Austria | 100.0 /100 | #8 | Exceptional 44.9% |
| Paraguayans | 100.0 /100 | #9 | Exceptional 45.0% |
| Bulgarians | 100.0 /100 | #10 | Exceptional 45.1% |
| Lithuanians | 100.0 /100 | #11 | Exceptional 45.1% |
| Immigrants | Czechoslovakia | 100.0 /100 | #12 | Exceptional 45.1% |
| Latvians | 100.0 /100 | #13 | Exceptional 45.1% |
| Immigrants | Scotland | 100.0 /100 | #14 | Exceptional 45.1% |
| Immigrants | Sweden | 100.0 /100 | #15 | Exceptional 45.1% |