Barbadian vs Tongan Disability Age Over 75
COMPARE
Barbadian
Tongan
Disability Age Over 75
Disability Age Over 75 Comparison
Barbadians
Tongans
48.0%
DISABILITY AGE OVER 75
6.8/ 100
METRIC RATING
222nd/ 347
METRIC RANK
48.3%
DISABILITY AGE OVER 75
2.3/ 100
METRIC RATING
240th/ 347
METRIC RANK
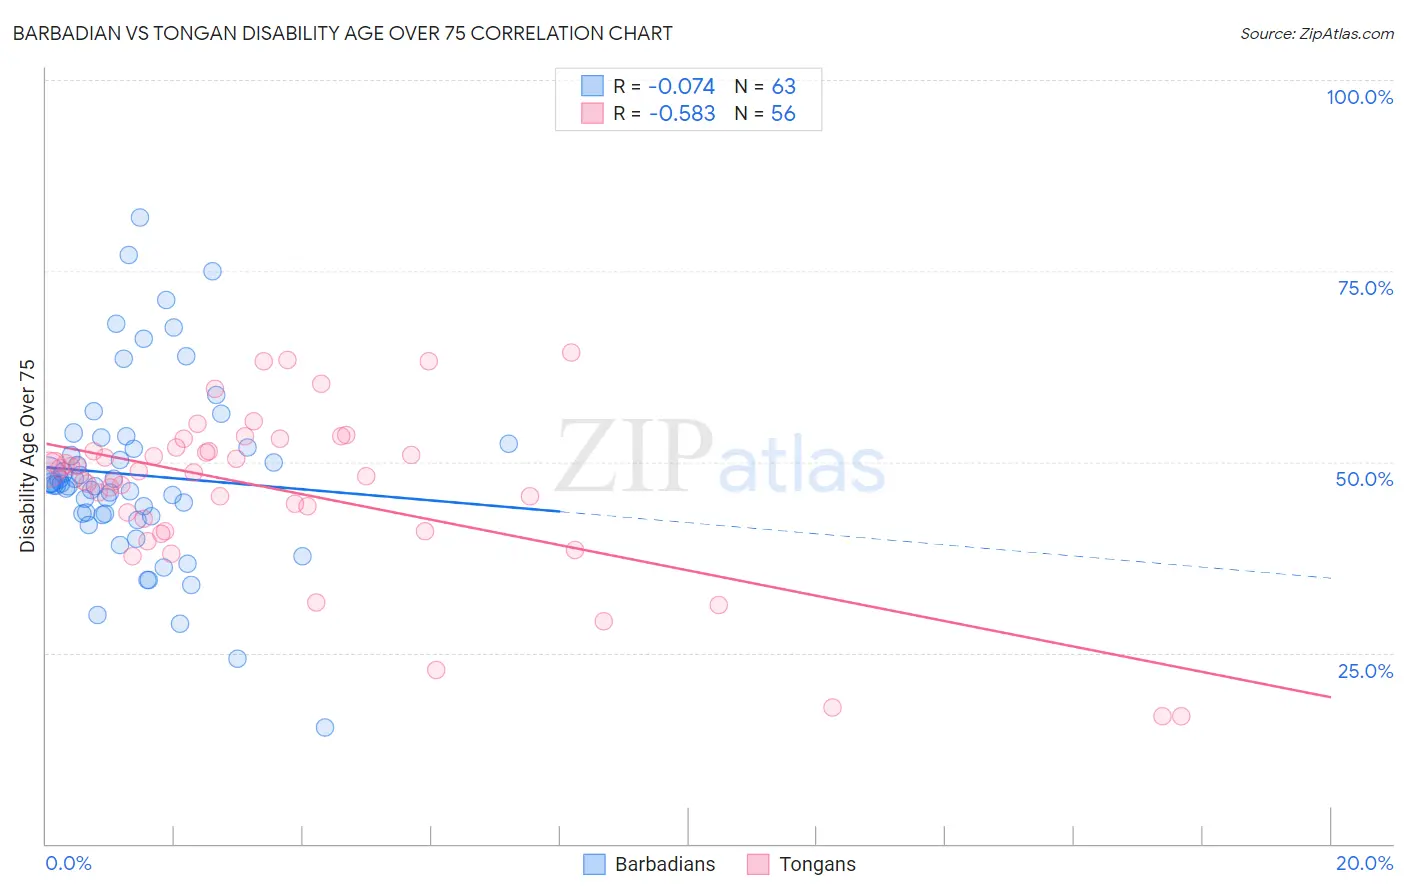
Barbadian vs Tongan Disability Age Over 75 Correlation Chart
The statistical analysis conducted on geographies consisting of 141,188,611 people shows a slight negative correlation between the proportion of Barbadians and percentage of population with a disability over the age of 75 in the United States with a correlation coefficient (R) of -0.074 and weighted average of 48.0%. Similarly, the statistical analysis conducted on geographies consisting of 102,804,895 people shows a substantial negative correlation between the proportion of Tongans and percentage of population with a disability over the age of 75 in the United States with a correlation coefficient (R) of -0.583 and weighted average of 48.3%, a difference of 0.63%.
Disability Age Over 75 Correlation Summary
| Measurement | Barbadian | Tongan |
| Minimum | 15.2% | 16.7% |
| Maximum | 82.0% | 64.3% |
| Range | 66.8% | 47.6% |
| Mean | 48.3% | 46.3% |
| Median | 46.9% | 48.7% |
| Interquartile 25% (IQ1) | 43.1% | 41.7% |
| Interquartile 75% (IQ3) | 52.4% | 51.6% |
| Interquartile Range (IQR) | 9.3% | 9.9% |
| Standard Deviation (Sample) | 12.0% | 10.8% |
| Standard Deviation (Population) | 11.9% | 10.7% |
Demographics Similar to Barbadians and Tongans by Disability Age Over 75
In terms of disability age over 75, the demographic groups most similar to Barbadians are Immigrants from Bangladesh (48.0%, a difference of 0.0%), Liberian (48.0%, a difference of 0.010%), Spanish (48.0%, a difference of 0.030%), Nonimmigrants (48.0%, a difference of 0.030%), and Immigrants from Oceania (48.0%, a difference of 0.040%). Similarly, the demographic groups most similar to Tongans are Native Hawaiian (48.3%, a difference of 0.010%), Immigrants from Thailand (48.3%, a difference of 0.11%), Nicaraguan (48.3%, a difference of 0.15%), Immigrants from Nicaragua (48.2%, a difference of 0.19%), and Immigrants from St. Vincent and the Grenadines (48.2%, a difference of 0.19%).
| Demographics | Rating | Rank | Disability Age Over 75 |
| Immigrants | Oceania | 7.3 /100 | #221 | Tragic 48.0% |
| Barbadians | 6.8 /100 | #222 | Tragic 48.0% |
| Immigrants | Bangladesh | 6.8 /100 | #223 | Tragic 48.0% |
| Liberians | 6.7 /100 | #224 | Tragic 48.0% |
| Spanish | 6.5 /100 | #225 | Tragic 48.0% |
| Immigrants | Nonimmigrants | 6.5 /100 | #226 | Tragic 48.0% |
| Zimbabweans | 6.4 /100 | #227 | Tragic 48.1% |
| Immigrants | Liberia | 5.9 /100 | #228 | Tragic 48.1% |
| Spaniards | 5.7 /100 | #229 | Tragic 48.1% |
| Taiwanese | 4.4 /100 | #230 | Tragic 48.2% |
| Immigrants | Immigrants | 4.3 /100 | #231 | Tragic 48.2% |
| Indonesians | 4.2 /100 | #232 | Tragic 48.2% |
| Cree | 4.2 /100 | #233 | Tragic 48.2% |
| Sub-Saharan Africans | 3.8 /100 | #234 | Tragic 48.2% |
| Hmong | 3.8 /100 | #235 | Tragic 48.2% |
| Immigrants | Nicaragua | 3.2 /100 | #236 | Tragic 48.2% |
| Immigrants | St. Vincent and the Grenadines | 3.2 /100 | #237 | Tragic 48.2% |
| Nicaraguans | 3.0 /100 | #238 | Tragic 48.3% |
| Immigrants | Thailand | 2.8 /100 | #239 | Tragic 48.3% |
| Tongans | 2.3 /100 | #240 | Tragic 48.3% |
| Native Hawaiians | 2.2 /100 | #241 | Tragic 48.3% |