Slovak vs Tongan Disability Age Over 75
COMPARE
Slovak
Tongan
Disability Age Over 75
Disability Age Over 75 Comparison
Slovaks
Tongans
45.8%
DISABILITY AGE OVER 75
99.6/ 100
METRIC RATING
54th/ 347
METRIC RANK
48.3%
DISABILITY AGE OVER 75
2.3/ 100
METRIC RATING
240th/ 347
METRIC RANK
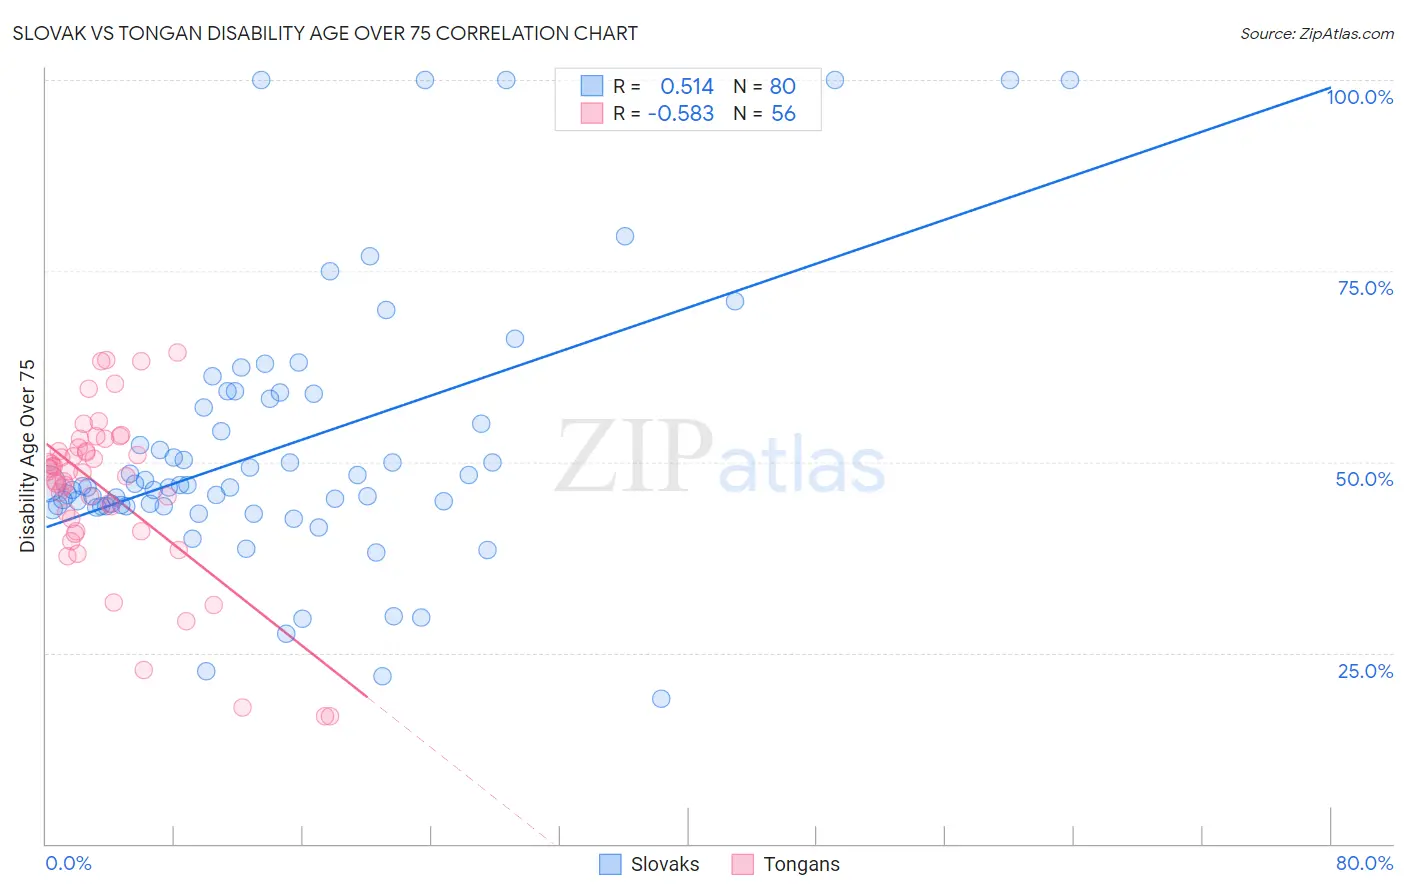
Slovak vs Tongan Disability Age Over 75 Correlation Chart
The statistical analysis conducted on geographies consisting of 397,228,440 people shows a substantial positive correlation between the proportion of Slovaks and percentage of population with a disability over the age of 75 in the United States with a correlation coefficient (R) of 0.514 and weighted average of 45.8%. Similarly, the statistical analysis conducted on geographies consisting of 102,804,895 people shows a substantial negative correlation between the proportion of Tongans and percentage of population with a disability over the age of 75 in the United States with a correlation coefficient (R) of -0.583 and weighted average of 48.3%, a difference of 5.4%.
Disability Age Over 75 Correlation Summary
| Measurement | Slovak | Tongan |
| Minimum | 19.0% | 16.7% |
| Maximum | 100.0% | 64.3% |
| Range | 81.0% | 47.6% |
| Mean | 52.1% | 46.3% |
| Median | 46.9% | 48.7% |
| Interquartile 25% (IQ1) | 44.2% | 41.7% |
| Interquartile 75% (IQ3) | 58.6% | 51.6% |
| Interquartile Range (IQR) | 14.4% | 9.9% |
| Standard Deviation (Sample) | 17.7% | 10.8% |
| Standard Deviation (Population) | 17.6% | 10.7% |
Similar Demographics by Disability Age Over 75
Demographics Similar to Slovaks by Disability Age Over 75
In terms of disability age over 75, the demographic groups most similar to Slovaks are Maltese (45.8%, a difference of 0.0%), Immigrants from Netherlands (45.9%, a difference of 0.070%), Immigrants from Italy (45.8%, a difference of 0.080%), Immigrants from Turkey (45.9%, a difference of 0.080%), and Immigrants from France (45.8%, a difference of 0.090%).
| Demographics | Rating | Rank | Disability Age Over 75 |
| Immigrants | Canada | 99.8 /100 | #47 | Exceptional 45.7% |
| Croatians | 99.8 /100 | #48 | Exceptional 45.7% |
| Immigrants | North America | 99.8 /100 | #49 | Exceptional 45.7% |
| Belgians | 99.7 /100 | #50 | Exceptional 45.8% |
| Immigrants | Korea | 99.7 /100 | #51 | Exceptional 45.8% |
| Immigrants | France | 99.7 /100 | #52 | Exceptional 45.8% |
| Immigrants | Italy | 99.7 /100 | #53 | Exceptional 45.8% |
| Slovaks | 99.6 /100 | #54 | Exceptional 45.8% |
| Maltese | 99.6 /100 | #55 | Exceptional 45.8% |
| Immigrants | Netherlands | 99.6 /100 | #56 | Exceptional 45.9% |
| Immigrants | Turkey | 99.6 /100 | #57 | Exceptional 45.9% |
| Immigrants | Israel | 99.6 /100 | #58 | Exceptional 45.9% |
| Iranians | 99.6 /100 | #59 | Exceptional 45.9% |
| Immigrants | Europe | 99.6 /100 | #60 | Exceptional 45.9% |
| Immigrants | Argentina | 99.6 /100 | #61 | Exceptional 45.9% |
Demographics Similar to Tongans by Disability Age Over 75
In terms of disability age over 75, the demographic groups most similar to Tongans are Native Hawaiian (48.3%, a difference of 0.010%), French American Indian (48.3%, a difference of 0.010%), Immigrants from Caribbean (48.4%, a difference of 0.050%), Immigrants from Thailand (48.3%, a difference of 0.11%), and Afghan (48.4%, a difference of 0.14%).
| Demographics | Rating | Rank | Disability Age Over 75 |
| Cree | 4.2 /100 | #233 | Tragic 48.2% |
| Sub-Saharan Africans | 3.8 /100 | #234 | Tragic 48.2% |
| Hmong | 3.8 /100 | #235 | Tragic 48.2% |
| Immigrants | Nicaragua | 3.2 /100 | #236 | Tragic 48.2% |
| Immigrants | St. Vincent and the Grenadines | 3.2 /100 | #237 | Tragic 48.2% |
| Nicaraguans | 3.0 /100 | #238 | Tragic 48.3% |
| Immigrants | Thailand | 2.8 /100 | #239 | Tragic 48.3% |
| Tongans | 2.3 /100 | #240 | Tragic 48.3% |
| Native Hawaiians | 2.2 /100 | #241 | Tragic 48.3% |
| French American Indians | 2.2 /100 | #242 | Tragic 48.3% |
| Immigrants | Caribbean | 2.1 /100 | #243 | Tragic 48.4% |
| Afghans | 1.8 /100 | #244 | Tragic 48.4% |
| Americans | 1.7 /100 | #245 | Tragic 48.4% |
| Chippewa | 1.6 /100 | #246 | Tragic 48.4% |
| Iroquois | 1.6 /100 | #247 | Tragic 48.4% |