Scotch-Irish vs Subsaharan African Professional Degree
COMPARE
Scotch-Irish
Subsaharan African
Professional Degree
Professional Degree Comparison
Scotch-Irish
Sub-Saharan Africans
4.3%
PROFESSIONAL DEGREE
34.2/ 100
METRIC RATING
186th/ 347
METRIC RANK
4.1%
PROFESSIONAL DEGREE
12.8/ 100
METRIC RATING
207th/ 347
METRIC RANK
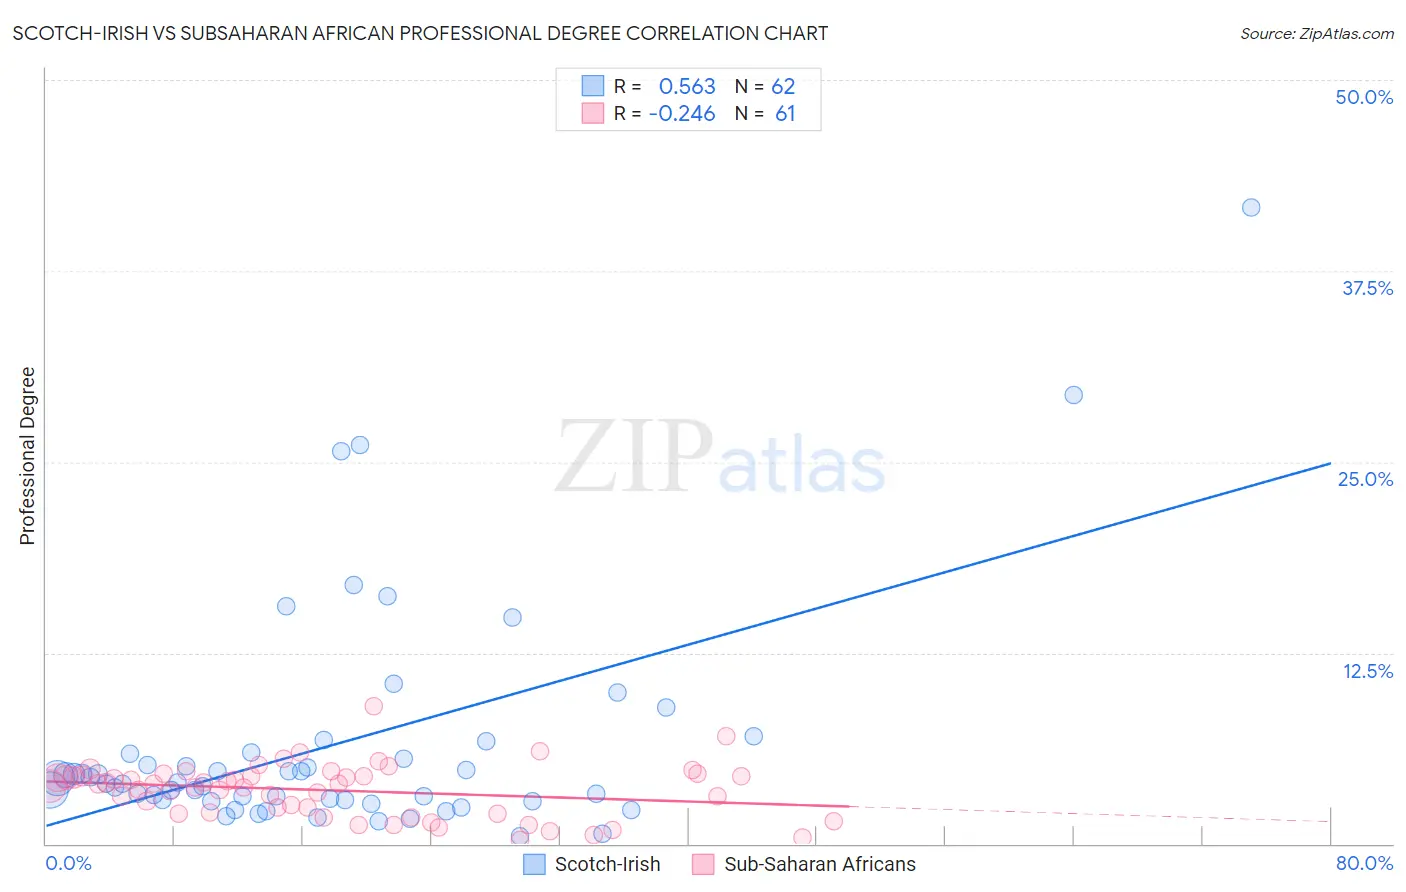
Scotch-Irish vs Subsaharan African Professional Degree Correlation Chart
The statistical analysis conducted on geographies consisting of 542,187,635 people shows a substantial positive correlation between the proportion of Scotch-Irish and percentage of population with at least professional degree education in the United States with a correlation coefficient (R) of 0.563 and weighted average of 4.3%. Similarly, the statistical analysis conducted on geographies consisting of 505,148,465 people shows a weak negative correlation between the proportion of Sub-Saharan Africans and percentage of population with at least professional degree education in the United States with a correlation coefficient (R) of -0.246 and weighted average of 4.1%, a difference of 5.0%.
Professional Degree Correlation Summary
| Measurement | Scotch-Irish | Subsaharan African |
| Minimum | 0.53% | 0.23% |
| Maximum | 41.7% | 9.0% |
| Range | 41.1% | 8.8% |
| Mean | 6.5% | 3.5% |
| Median | 4.0% | 3.9% |
| Interquartile 25% (IQ1) | 2.8% | 2.0% |
| Interquartile 75% (IQ3) | 5.9% | 4.4% |
| Interquartile Range (IQR) | 3.0% | 2.4% |
| Standard Deviation (Sample) | 7.5% | 1.7% |
| Standard Deviation (Population) | 7.4% | 1.7% |
Similar Demographics by Professional Degree
Demographics Similar to Scotch-Irish by Professional Degree
In terms of professional degree, the demographic groups most similar to Scotch-Irish are Immigrants from Cameroon (4.3%, a difference of 0.15%), Welsh (4.3%, a difference of 0.27%), Belgian (4.3%, a difference of 0.32%), Immigrants from Thailand (4.3%, a difference of 0.43%), and Slovak (4.3%, a difference of 0.60%).
| Demographics | Rating | Rank | Professional Degree |
| Immigrants | Kenya | 45.9 /100 | #179 | Average 4.4% |
| Czechs | 44.9 /100 | #180 | Average 4.4% |
| Danes | 43.5 /100 | #181 | Average 4.4% |
| Immigrants | Immigrants | 43.2 /100 | #182 | Average 4.4% |
| Bermudans | 43.1 /100 | #183 | Average 4.4% |
| Belgians | 36.2 /100 | #184 | Fair 4.3% |
| Welsh | 35.8 /100 | #185 | Fair 4.3% |
| Scotch-Irish | 34.2 /100 | #186 | Fair 4.3% |
| Immigrants | Cameroon | 33.3 /100 | #187 | Fair 4.3% |
| Immigrants | Thailand | 31.7 /100 | #188 | Fair 4.3% |
| Slovaks | 30.7 /100 | #189 | Fair 4.3% |
| Immigrants | Poland | 29.2 /100 | #190 | Fair 4.3% |
| Sri Lankans | 29.0 /100 | #191 | Fair 4.3% |
| Ghanaians | 27.3 /100 | #192 | Fair 4.3% |
| French | 27.1 /100 | #193 | Fair 4.2% |
Demographics Similar to Sub-Saharan Africans by Professional Degree
In terms of professional degree, the demographic groups most similar to Sub-Saharan Africans are Immigrants from Somalia (4.1%, a difference of 0.080%), Immigrants from Panama (4.1%, a difference of 0.16%), Yugoslavian (4.1%, a difference of 0.24%), Immigrants from Nigeria (4.1%, a difference of 0.38%), and German (4.1%, a difference of 0.42%).
| Demographics | Rating | Rank | Professional Degree |
| Immigrants | North Macedonia | 20.2 /100 | #200 | Fair 4.2% |
| Finns | 18.7 /100 | #201 | Poor 4.2% |
| Immigrants | Iraq | 17.1 /100 | #202 | Poor 4.2% |
| Panamanians | 15.9 /100 | #203 | Poor 4.1% |
| Barbadians | 15.8 /100 | #204 | Poor 4.1% |
| Somalis | 14.8 /100 | #205 | Poor 4.1% |
| Yugoslavians | 13.4 /100 | #206 | Poor 4.1% |
| Sub-Saharan Africans | 12.8 /100 | #207 | Poor 4.1% |
| Immigrants | Somalia | 12.5 /100 | #208 | Poor 4.1% |
| Immigrants | Panama | 12.3 /100 | #209 | Poor 4.1% |
| Immigrants | Nigeria | 11.7 /100 | #210 | Poor 4.1% |
| Germans | 11.6 /100 | #211 | Poor 4.1% |
| Whites/Caucasians | 11.2 /100 | #212 | Poor 4.1% |
| Koreans | 10.7 /100 | #213 | Poor 4.1% |
| Immigrants | Ghana | 10.6 /100 | #214 | Poor 4.1% |