Scotch-Irish vs Subsaharan African Unemployment Among Ages 65 to 74 years
COMPARE
Scotch-Irish
Subsaharan African
Unemployment Among Ages 65 to 74 years
Unemployment Among Ages 65 to 74 years Comparison
Scotch-Irish
Sub-Saharan Africans
5.2%
UNEMPLOYMENT AMONG AGES 65 TO 74 YEARS
99.0/ 100
METRIC RATING
71st/ 347
METRIC RANK
5.4%
UNEMPLOYMENT AMONG AGES 65 TO 74 YEARS
14.4/ 100
METRIC RATING
202nd/ 347
METRIC RANK
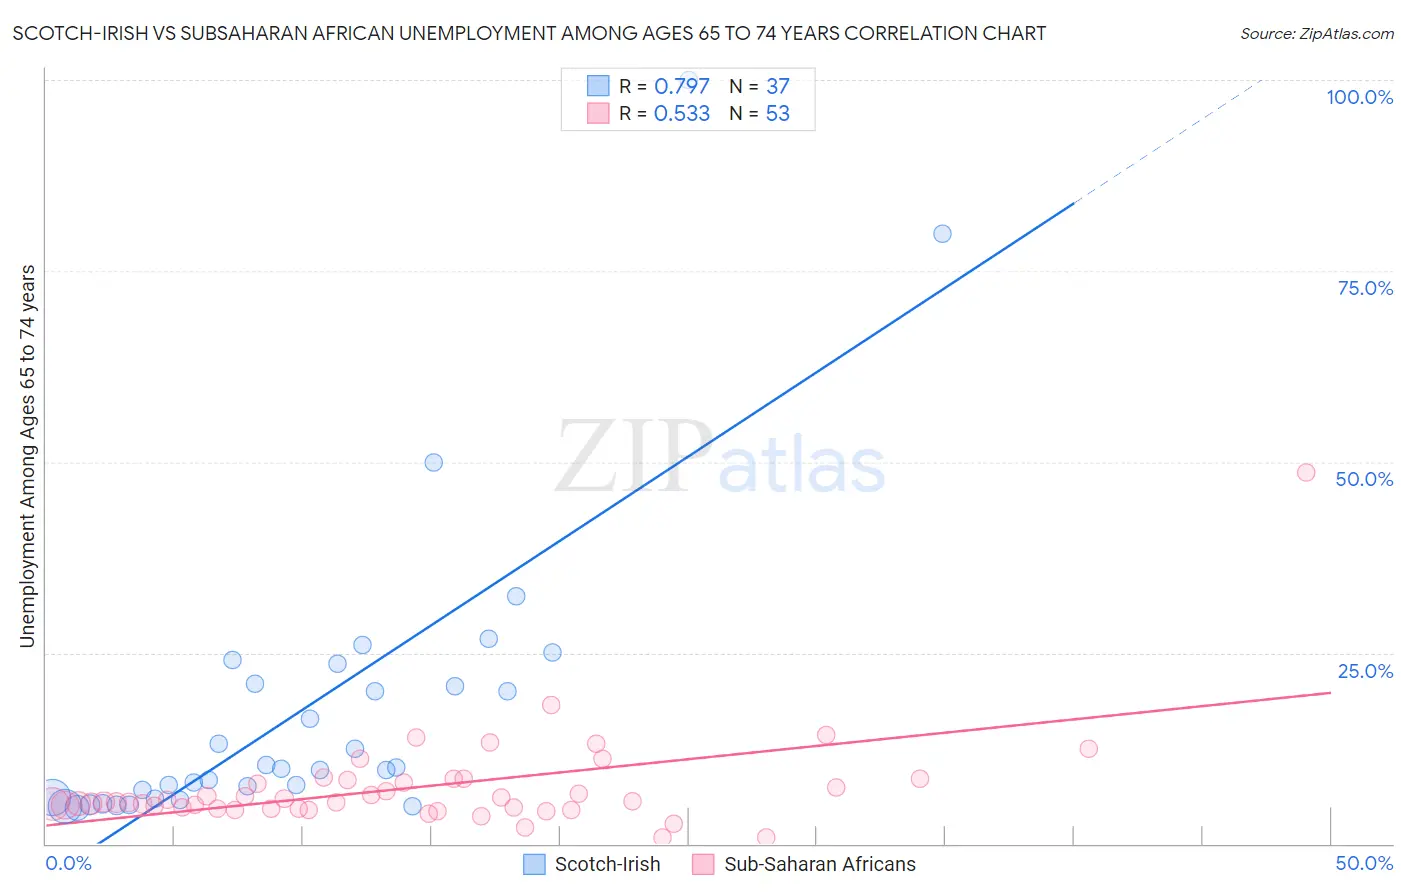
Scotch-Irish vs Subsaharan African Unemployment Among Ages 65 to 74 years Correlation Chart
The statistical analysis conducted on geographies consisting of 431,743,679 people shows a strong positive correlation between the proportion of Scotch-Irish and unemployment rate among population between the ages 65 and 74 in the United States with a correlation coefficient (R) of 0.797 and weighted average of 5.2%. Similarly, the statistical analysis conducted on geographies consisting of 423,071,215 people shows a substantial positive correlation between the proportion of Sub-Saharan Africans and unemployment rate among population between the ages 65 and 74 in the United States with a correlation coefficient (R) of 0.533 and weighted average of 5.4%, a difference of 5.5%.
Unemployment Among Ages 65 to 74 years Correlation Summary
| Measurement | Scotch-Irish | Subsaharan African |
| Minimum | 4.7% | 0.80% |
| Maximum | 100.0% | 48.6% |
| Range | 95.3% | 47.8% |
| Mean | 17.8% | 7.4% |
| Median | 9.8% | 5.5% |
| Interquartile 25% (IQ1) | 6.0% | 4.6% |
| Interquartile 75% (IQ3) | 22.2% | 8.4% |
| Interquartile Range (IQR) | 16.3% | 3.8% |
| Standard Deviation (Sample) | 20.2% | 6.7% |
| Standard Deviation (Population) | 19.9% | 6.6% |
Similar Demographics by Unemployment Among Ages 65 to 74 years
Demographics Similar to Scotch-Irish by Unemployment Among Ages 65 to 74 years
In terms of unemployment among ages 65 to 74 years, the demographic groups most similar to Scotch-Irish are Immigrants from Oceania (5.2%, a difference of 0.010%), Filipino (5.2%, a difference of 0.030%), Afghan (5.2%, a difference of 0.040%), Okinawan (5.2%, a difference of 0.050%), and Estonian (5.2%, a difference of 0.050%).
| Demographics | Rating | Rank | Unemployment Among Ages 65 to 74 years |
| Immigrants | Moldova | 99.3 /100 | #64 | Exceptional 5.1% |
| Bolivians | 99.3 /100 | #65 | Exceptional 5.1% |
| Iroquois | 99.3 /100 | #66 | Exceptional 5.1% |
| Swiss | 99.2 /100 | #67 | Exceptional 5.1% |
| Latvians | 99.2 /100 | #68 | Exceptional 5.1% |
| Scandinavians | 99.1 /100 | #69 | Exceptional 5.2% |
| Immigrants | Japan | 99.1 /100 | #70 | Exceptional 5.2% |
| Scotch-Irish | 99.0 /100 | #71 | Exceptional 5.2% |
| Immigrants | Oceania | 99.0 /100 | #72 | Exceptional 5.2% |
| Filipinos | 99.0 /100 | #73 | Exceptional 5.2% |
| Afghans | 99.0 /100 | #74 | Exceptional 5.2% |
| Okinawans | 99.0 /100 | #75 | Exceptional 5.2% |
| Estonians | 99.0 /100 | #76 | Exceptional 5.2% |
| Immigrants | Sudan | 98.9 /100 | #77 | Exceptional 5.2% |
| Northern Europeans | 98.9 /100 | #78 | Exceptional 5.2% |
Demographics Similar to Sub-Saharan Africans by Unemployment Among Ages 65 to 74 years
In terms of unemployment among ages 65 to 74 years, the demographic groups most similar to Sub-Saharan Africans are Argentinean (5.4%, a difference of 0.0%), Seminole (5.4%, a difference of 0.0%), Icelander (5.4%, a difference of 0.010%), Immigrants from Western Asia (5.4%, a difference of 0.030%), and Immigrants from Pakistan (5.4%, a difference of 0.060%).
| Demographics | Rating | Rank | Unemployment Among Ages 65 to 74 years |
| Immigrants | China | 24.2 /100 | #195 | Fair 5.4% |
| Costa Ricans | 21.1 /100 | #196 | Fair 5.4% |
| Colville | 20.4 /100 | #197 | Fair 5.4% |
| Albanians | 17.8 /100 | #198 | Poor 5.4% |
| Immigrants | Belgium | 16.2 /100 | #199 | Poor 5.4% |
| Immigrants | Pakistan | 15.2 /100 | #200 | Poor 5.4% |
| Immigrants | Western Asia | 14.9 /100 | #201 | Poor 5.4% |
| Sub-Saharan Africans | 14.4 /100 | #202 | Poor 5.4% |
| Argentineans | 14.3 /100 | #203 | Poor 5.4% |
| Seminole | 14.3 /100 | #204 | Poor 5.4% |
| Icelanders | 14.2 /100 | #205 | Poor 5.4% |
| Africans | 12.8 /100 | #206 | Poor 5.5% |
| Immigrants | Uzbekistan | 12.5 /100 | #207 | Poor 5.5% |
| Dutch West Indians | 11.5 /100 | #208 | Poor 5.5% |
| Immigrants | Honduras | 10.4 /100 | #209 | Poor 5.5% |