Scotch-Irish vs Subsaharan African Unemployment Among Ages 35 to 44 years
COMPARE
Scotch-Irish
Subsaharan African
Unemployment Among Ages 35 to 44 years
Unemployment Among Ages 35 to 44 years Comparison
Scotch-Irish
Sub-Saharan Africans
4.6%
UNEMPLOYMENT AMONG AGES 35 TO 44 YEARS
79.3/ 100
METRIC RATING
136th/ 347
METRIC RANK
5.3%
UNEMPLOYMENT AMONG AGES 35 TO 44 YEARS
0.1/ 100
METRIC RATING
260th/ 347
METRIC RANK
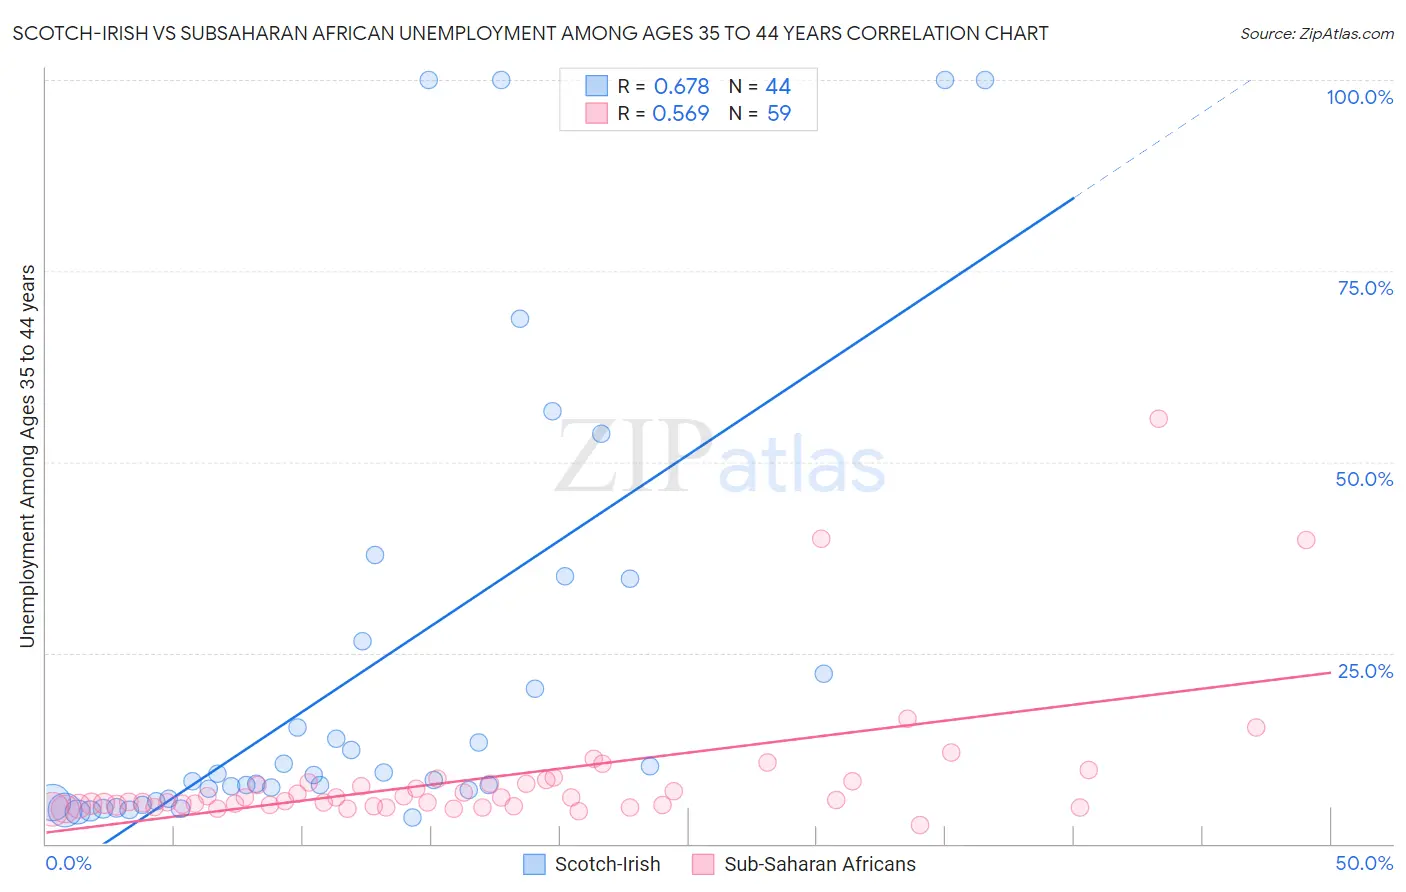
Scotch-Irish vs Subsaharan African Unemployment Among Ages 35 to 44 years Correlation Chart
The statistical analysis conducted on geographies consisting of 513,888,512 people shows a significant positive correlation between the proportion of Scotch-Irish and unemployment rate among population between the ages 35 and 44 in the United States with a correlation coefficient (R) of 0.678 and weighted average of 4.6%. Similarly, the statistical analysis conducted on geographies consisting of 489,916,914 people shows a substantial positive correlation between the proportion of Sub-Saharan Africans and unemployment rate among population between the ages 35 and 44 in the United States with a correlation coefficient (R) of 0.569 and weighted average of 5.3%, a difference of 15.1%.
Unemployment Among Ages 35 to 44 years Correlation Summary
| Measurement | Scotch-Irish | Subsaharan African |
| Minimum | 3.5% | 2.5% |
| Maximum | 100.0% | 55.6% |
| Range | 96.5% | 53.1% |
| Mean | 22.5% | 8.6% |
| Median | 8.6% | 5.8% |
| Interquartile 25% (IQ1) | 5.8% | 4.9% |
| Interquartile 75% (IQ3) | 24.4% | 7.9% |
| Interquartile Range (IQR) | 18.6% | 3.0% |
| Standard Deviation (Sample) | 28.9% | 9.1% |
| Standard Deviation (Population) | 28.6% | 9.0% |
Similar Demographics by Unemployment Among Ages 35 to 44 years
Demographics Similar to Scotch-Irish by Unemployment Among Ages 35 to 44 years
In terms of unemployment among ages 35 to 44 years, the demographic groups most similar to Scotch-Irish are Immigrants from Europe (4.6%, a difference of 0.010%), Immigrants from Iraq (4.6%, a difference of 0.040%), Laotian (4.6%, a difference of 0.090%), Syrian (4.6%, a difference of 0.16%), and Colombian (4.6%, a difference of 0.17%).
| Demographics | Rating | Rank | Unemployment Among Ages 35 to 44 years |
| Immigrants | Croatia | 83.1 /100 | #129 | Excellent 4.6% |
| Immigrants | Eritrea | 82.8 /100 | #130 | Excellent 4.6% |
| Immigrants | Colombia | 82.6 /100 | #131 | Excellent 4.6% |
| Colombians | 80.8 /100 | #132 | Excellent 4.6% |
| Syrians | 80.7 /100 | #133 | Excellent 4.6% |
| Laotians | 80.1 /100 | #134 | Excellent 4.6% |
| Immigrants | Europe | 79.4 /100 | #135 | Good 4.6% |
| Scotch-Irish | 79.3 /100 | #136 | Good 4.6% |
| Immigrants | Iraq | 78.9 /100 | #137 | Good 4.6% |
| Immigrants | Norway | 77.5 /100 | #138 | Good 4.6% |
| Immigrants | Hungary | 76.3 /100 | #139 | Good 4.6% |
| Immigrants | Eastern Africa | 76.0 /100 | #140 | Good 4.6% |
| Canadians | 75.9 /100 | #141 | Good 4.6% |
| Ukrainians | 75.8 /100 | #142 | Good 4.6% |
| Immigrants | Switzerland | 75.5 /100 | #143 | Good 4.6% |
Demographics Similar to Sub-Saharan Africans by Unemployment Among Ages 35 to 44 years
In terms of unemployment among ages 35 to 44 years, the demographic groups most similar to Sub-Saharan Africans are Mexican (5.3%, a difference of 0.030%), Immigrants from Latin America (5.3%, a difference of 0.13%), Spanish American (5.3%, a difference of 0.20%), Immigrants from Fiji (5.3%, a difference of 0.25%), and Seminole (5.2%, a difference of 0.53%).
| Demographics | Rating | Rank | Unemployment Among Ages 35 to 44 years |
| Mexican American Indians | 0.2 /100 | #253 | Tragic 5.2% |
| Immigrants | Bahamas | 0.2 /100 | #254 | Tragic 5.2% |
| Cherokee | 0.2 /100 | #255 | Tragic 5.2% |
| Seminole | 0.1 /100 | #256 | Tragic 5.2% |
| Immigrants | Fiji | 0.1 /100 | #257 | Tragic 5.3% |
| Immigrants | Latin America | 0.1 /100 | #258 | Tragic 5.3% |
| Mexicans | 0.1 /100 | #259 | Tragic 5.3% |
| Sub-Saharan Africans | 0.1 /100 | #260 | Tragic 5.3% |
| Spanish Americans | 0.1 /100 | #261 | Tragic 5.3% |
| Immigrants | Central America | 0.1 /100 | #262 | Tragic 5.3% |
| Choctaw | 0.1 /100 | #263 | Tragic 5.3% |
| Ghanaians | 0.1 /100 | #264 | Tragic 5.3% |
| Yaqui | 0.1 /100 | #265 | Tragic 5.3% |
| Immigrants | Bangladesh | 0.1 /100 | #266 | Tragic 5.3% |
| Immigrants | Western Africa | 0.0 /100 | #267 | Tragic 5.3% |